Keywords: baby boomers, millenials, gen xers, macro and competitive forces, industry dynamics, wine consumption.
CASE SUMMARY
California wine shipments in the U.S. passed the USD 40 billion mark in 2018, rising three percent from the previous year, as interest in premium wines continued to be strong. After 25 years of wine business expansion, however, growth is slowing. U.S. table wine consumption strongly outpaced the U.S. population growth from 1993 to 2018. Until the early 2000s wine marketing in the U.S. has focused primarily on the Baby Boomers, the large and affluent generation that has been the main wine consuming cohort over the last 25 years. Nonetheless, the median Baby Boomer will hit retirement age in 2023, and their wine purchasing seems to be moderating in both price and volume; alcohol consumption in this cohort is slowing as they age. A vital concern for winemakers will be to how best serve the primary wine buying cohort that is shifting from the Baby Boomer to the Gen Xer, and subsequently in another five years to the Millennial generation. Deciding how to serve the three different cohorts as they move through their respective life stages will be all-important. The product-focused approach that led to success in the past might not be enough to cater to the needs of Gen X or the Millennials as wine sales shift to the younger cohorts. The younger generations have very different consumption patterns, preferences, and values as compared to the Baby Boomers. Branding is likely to remain important but the ways to attract and appeal to younger buyers appear to be changing.
|
General Environment Factor /
Key Change Driver
|
Industry Impact
|
|---|---|
|
Legal /
Wine distribution changes
|
- increasing DTC (most relevant for small winery)
- challenge of reaching new consumers
|
|
Sociocultural /
Change in demographic mix of the wine consumer
|
- purchasing patterns are changing across generations
- wine country visitations are declining, challenging wineries to re-invent wine consumer introductions
- some wine categories remain popular while some are increasing and some decreasing
|
|
Sociocultural /
Change in norms and values of the wine consumer
|
- brand-building changes from product (internal focus) to creating “buzz” with innovative names, labels, associations with lifestyle experiences (external focus)
- value of AVA/terroir traditions are shifting
- sustainability / legitimacy of winemaking is now valued
|
|
Technology /
Change in wine packaging
|
- boxes and cans are now becoming a more acceptable packaging option
|
|
Option
|
Description
|
|---|---|
|
Alternative containers and labeling
|
- “test the waters” by introducing boxed and canned wines; assess buyer response before large-scale introduction; may prove popular with Gen X and Millennials
- unique labels and names to attract Millennials
- traditional labels and bottles for Baby Boomers
|
|
Segment-specific branding
|
- product-oriented for Baby Boomers stressing traditional vintages and/or estates; wine critic recommendations
- U.S. made for Generation X
- social media advertisements of “experiences / indulgences” and/or sustainability (below) for Millennials
- introduce wines at targeted area entertainment and/or educational events (relevant to generational cohorts)
|
|
Sustainability designations to attract younger buyers
|
- make changes to wine growing and/or sourcing to earn independent sustainability designations
|
|
Varietal emphasis
|
- change wine emphasis (depending on resources and capabilities of the winery):
1) Cabernet Sauvignon and Pinot Noir show strong growth (reds)
2) Sauvignon Blanc shows strong growth; Chardonnay a consistent favorite (white)
3) Blended red wines and Blended blush wines (strong growth) to create uniqueness for younger buyers
|
The fundamental underpinnings that created the industry growth are changing, which means the tactics that were relied upon to ride this wave of success to this point will slowly prove flawed without business adaptation.
—Rob McMillan, State of the Wine Industry Report 2019,
Silicon Valley Bank Wine Division
I am not sure I would portray the industry situation as a recession. However, I think we may be in for slower long-term growth than what the industry has been accustomed to.
—Jon Moramarco, industry analyst,
as quoted in Wine Business Monthly, December 2019
Exhibit 1
U.S. Population and Table Wine Consumption (in thousands)
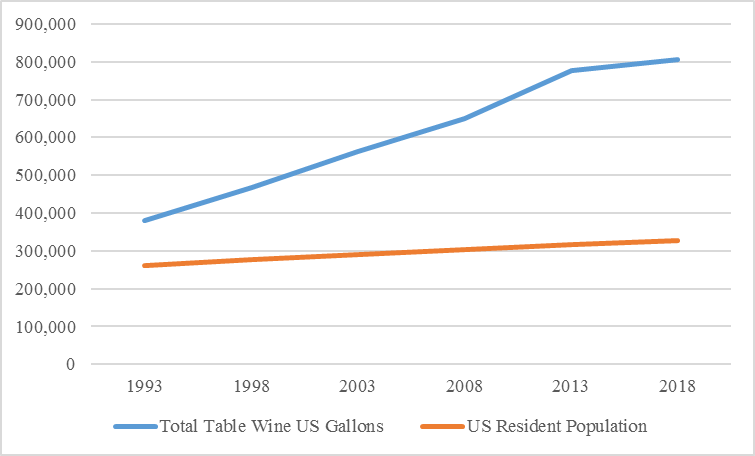
Sources: Bureau of Census. (2019). Resident Population Projections by Sex and Age: 2020 to 2060 Quinquennially, as of July 1, ProQuest Statistical Abstract of the U.S. 2019 Online Edition. Retrieved July 25, 2019, from https://statabs-proquest-com.lynx.lib.usm.edu/sa/docview.html?table-no=2... The Wine Institute. (n.d.). Wine consumption in the U.S. Retrieved July 18, 2019, from https://www.wineinstitute.org/resources/statistics/article86.
|
Price Tier
|
52 Weeks Ending
1/4/2014
|
52 Weeks Ending
12/30/2017
|
|---|---|---|
|
$0–2.99
|
$814,858,065
|
$765,574,394
|
|
$3–5.99
|
3,995,816,700
|
4,165,256,641
|
|
$6–8.99
|
1,771,619,674
|
1,503,072,494
|
|
$9–11.99
|
2,953,458,815
|
3,306,015,857
|
|
$12–14.99
|
1,182,403,930
|
1,964,076,336
|
|
$15–19.99
|
722,524,114
|
1,314,199,512
|
|
>$20
|
720,303,300
|
1,089,624,291
|
Sources: Wine Business Monthly. (2014, April). Off-Premise Wine Sales Increase 4.8 Percent through December. 21(4), 70–71; Wine Business Monthly. (2018, March). Off-Premise Wine Sales Increase .3 Percent. 25(3). 90–91.
|
|
Dollar Value
|
9L Equivalent Volume
|
||
|---|---|---|---|---|
|
|
52 weeks ending 12/29/2018
|
52 weeks ending 12/28/2019
|
52 weeks ending 12/29/2018
|
52 weeks ending 12/28/2019
|
|
Glass Price Tiers
|
|
|
|
|
|
$0–3.99
|
$713,297,370
|
$636,254,531
|
18,072,766
|
15,746,616
|
|
$4–7.99
|
3,238,872,015
|
3,082,680,511
|
49,253,424
|
46,557,066
|
|
$8–10.99
|
3,431,746,152
|
3,267,145,413
|
30,338,528
|
28,742,359
|
|
$11–14.99
|
2,690,110,164
|
2,868,170,044
|
17,781,675
|
18,974,715
|
|
$15–19.99
|
1,295,335,929
|
1,441,806,926
|
6,335,574
|
7,063,699
|
|
$20–24.99
|
608,632,238
|
596,542,051
|
2,362,114
|
2,278,534
|
|
>$25
|
713,604,457
|
792,460,281
|
1,489,966
|
1,638,003
|
|
|
|
|
|
|
|
Box Price Tiers
|
|
|
|
|
|
$0–3.99
|
$574,191,221
|
$575,952,056
|
20,250,498
|
19,832,746
|
|
$4+
|
772,926,729
|
850,913,782
|
13,051,054
|
14,152,833
|
Sources: Wine Business Monthly. (2019, March). Nielsen Table Wine Category Segments. 26(3). 113.; Wine Business Monthly. (2020, March). Nielsen Table Wine Category Segments. 27(3). 97.
Winemaking was a globally competitive industry with large wineries such as E. & J. Gallo, Constellation Brands, and Treasury Wine Estates dominating the business during this period. However, small California wineries had carved out successful and profitable niches. Some of these wineries found great success serving the premium wine markets, while typically abandoning the value-priced and lower-end market segments to the larger wineries that were able to benefit from economies of scale. The top three wineries in the U.S. accounted for 38.6 percent of industry volume in 2019, and the top 10 accounted for 57 percent (See Exhibit 4). According to Wine Business Monthly the top 50 companies’ share of domestic wine sold was over 90 percent by volume.[6] Since there were more than 10,000 U.S. wineries in total by 2019,[7] the remaining 10 percent of volume was shared by thousands of firms. On average, wineries were small[8] and expected to employ fewer than 10 workers in 2019.[9] Small wineries produced between 5,000 and 49,999 cases per year, whereas those that produced less than 5,000 cases per year were classified as “boutique.”[10] Those that produced between 50,000 and 499,999 were classified as “medium,” and those that produced 500,000 or more were classified as “large.”[11]
|
Company
|
U.S. Case Volume Sold
|
|---|---|
|
E. & J. Gallo Winery
|
70.0
|
|
The Wine Group
|
53.0
|
|
Constellation Brands
|
35.0
|
|
Trinchero Family Estates
|
20.0
|
|
Treasury Wine Estates
|
14.0
|
|
Delicato Family Wines
|
13.0
|
|
Bronco Wine Company
|
10.0
|
|
Ste. Michelle Wine Estates
|
8.2
|
|
Jackson Family Wines
|
6.0
|
|
Deutsch Family Wine & Spirits
|
4.3
|
Source: Wine Business Monthly. (2020, February). 50 Largest Wineries. 27(2), 34.
THE INDUSTRY VALUE CHAIN, REGULATION, AND DISTRIBUTION
The U.S. wine industry value chain in 2019 consisted of three stages: wine production, distribution, and retailing; a three-tier system that had been required by law since the end of Prohibition in 1933. This system remained untouched until 2005 when the U.S. Supreme Court case Granholm vs. Heald, 2005, permitted wineries to initiate direct sales to consumers (DTC) – subject to each state’s laws governing sale and distribution of alcoholic beverages.[12] Wine producers engaged in at least one of the winemaking process components, which included growing and harvesting grapes, crushing pressed grapes into unfermented wine, and wine fermentation.[13] As the industry was capital intensive, a major decision that affected virtually all operations was the choice between vertical integration (planting, irrigating, and harvesting) and outsourcing (buying grapes externally), as it affected both costs and the types of wines that a winery could produce.[14] While outsourcing increased the availability of grapes for production consistencies, owning acreage for production aided brand development and uniqueness. Wineries that owned vineyards could also draw in visitors to explore and taste wines.
The industry was regulated at both federal and state levels. Several federal agencies regulated key components of the business, while the states regulated distribution.[15] The Department of Alcohol, Tobacco, and Firearms regulated containers to ensure that they did not look like soft drink or water containers. The Food and Drug Administration regulated labeling, whereas the Federal Trade Commission regulated marketing and data collection practices.[16] The states implemented the three-tier system to prevent organized crime from controlling alcohol distribution, thus wineries distributed products through regional U.S. wholesalers. These wholesalers in turn sold wines to “on-premise” retailers, such as restaurants and hotels, and “off-premise” retailers, such as supermarkets, mass merchandisers, and liquor stores.[17] In some “controlled” states, the state acted as a wholesaler of spirits and wines.[18] At the time, there were 17 states that had a monopoly over the wholesaling and retailing of alcoholic beverages.[19] Despite consolidation in wine and spirits wholesaling, the top four distributors captured only 29 percent of that industry’s revenue, so small-scale wholesaling remained an important factor in alcohol distribution.[20]
The Granholm vs. Heald, 2005, case created significant opportunities for the small California winemaker, as DTC allowed smaller wineries to bypass traditional distribution channels and sell directly to customers by relying heavily on tasting room visitations to build brand familiarity. By the end of 2019, DTC sales made up 60 percent of the average small winery’s revenue—as 28 percent of those DTC sales came from tasting room purchases, 23 percent from wine club sales, and 10 percent from mailing lists or subscriptions.[21] By 2019 only seven states (Alabama, Arkansas, Delaware, Minnesota, Mississippi, Rhode Island, and Utah) still prohibited DTC wine sales.[22] Direct-to-Consumer sales comprised 4.6 percent of total U.S. wine sales in 2019.[23], [24]
COMPETITIVE DIMENSIONS
A 2010–2018 industry database showed that for U.S. wineries producing between 1,000 and 750,000 cases, gross margins approached 57 percent and pretax profit was 10 percent at the end of the period.[25] While average profit margin for the entire industry was expected to reach 11.7 percent in 2019, large multinational wine producers experienced nearly double the profit margins of medium-sized producers.[26] Five key success factors for the wine industry as identified by IBISWorld were:
- Establishment of export markets
- Establishment of brand names
- Achievement of economies of scope
- Achievement of economies of scale
- Securing supply contracts for key inputs.[27]
With respect to the five success factors, smaller wineries were primarily engaged in branding and input supply contracts. Export sales, economies of scale, and economies of scope tended to be characteristic of larger wineries.[28]
Purchases of inputs such as grapes, preservatives, bottles, packaging, and raw materials comprised the largest expense for wineries (38 percent in 2019), followed by labor, which accounted for approximately 12 percent of industry revenues in 2019.[29] The industry was heavily dependent on labor for grape harvesting, winemaking, and research and development.[30] Wage expenses were expected to increase at an annualized rate of 3.9 percent over the years 2020 to 2024 due to a greater emphasis on more costly labor for artisanal craftsmanship and research and development.[31]
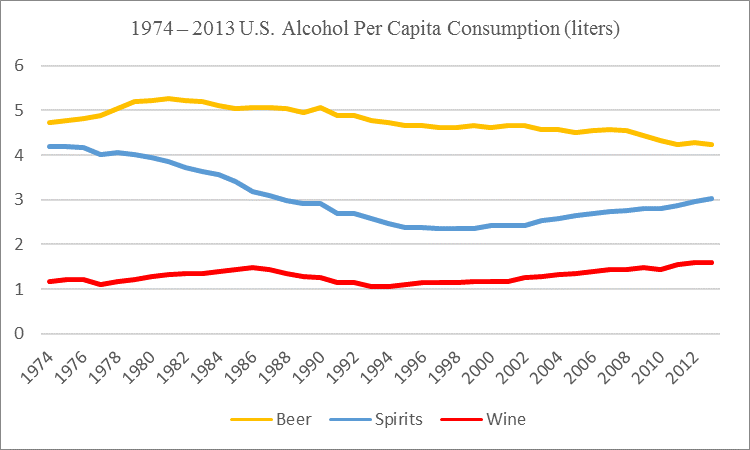
Competition appeared to be increasing as a result of inroads from international winemakers and as consumption patterns trended toward craft beers and spirits.[32] Exhibit 5 presents the 1974–2013 U.S. alcohol per capita consumption trends. Since the mid-1990s, wine and spirits consumption has increased while beer consumption has decreased. However, craft beer sales grew from USD 2.5 billion in 2011 to USD 7.4 billion in 2019.[33]
Exhibit 5
1974 – 2013 U.S. Alcohol Consumption by Beverage Type

 Source: Ritchie, H., & Roser, M. (2019, November). Alcohol consumption per person, United States, 1850 to 2013. In OurWorldInData.org. Retrieved April 23, 2020, from: https://ourworldindata.org/alcohol-consumption#all-charts-preview.
Prospective new entrants into the wine industry faced competition from major alcoholic beverage manufacturers and thousands of producers with a head start on building brand awareness and reputations with distributors and retailers.[34] While California land prices had been historically high, small-scale production could be achieved as a virtual winery in which the services of a bonded winery (production and bottling) were used. Although start-up costs for land and equipment may have been lower with this option, small scale production inhibited distribution channel access—wholesalers often preferred to deal with manufacturers that could supply large quantities and several varieties of wine.[35], [36]
The popularity of individual wine varietals (wines made from a single grape variety)[37] shifted from 2014–2019. Contrary to European traditions that stressed the geographic locations from which wines were made, U.S. wineries labeled wines by the grape varieties from which the wines were made. Cabernet Sauvignon and Chardonnay had been the most popular varieties for decades. However, as shown in Exhibit 6, which presents the 2015 and 2019 USD value sales by varietals, Cabernet Sauvignon, blended red wines, and Sauvignon Blanc sales had risen by 24 percent, 26 percent, and 33 percent, respectively. Rosé wines surged in popularity (up 390 percent), while Merlot (down 19 percent) and White Zinfandel (down 23 percent), both highly popular in the 1980s and 1990s, declined. The rise in popularity of red blends may be due to their flavor being more smooth or approachable, or simply an outcome of wine drinkers’ desire to experiment with flavors.[38] This latter explanation may also apply to the increases in popularity of Pinot Noir and Pinot Grigio.[39] The key selling point of Sauvignon Blanc, and perhaps an explanation for its worldwide popularity, is its straightforwardness in flavors that range from dry and crisp to sweet and lush.[40] Lastly, Rosé appeared to be 2019’s favorite sweet pink wine, replacing White Zinfandel which was once so popular that mocking it became as trendy as drinking it.[41]
|
Varietal
|
52 weeks ending 1/2/2016
|
52 weeks ending 12/28/2019
|
Percent change
|
|---|---|---|---|
|
Chardonnay
|
$2,499,285,237
|
$2,548,611,548
|
2.0%
|
|
Cabernet Sauvignon
|
2,186,566,979
|
2,712,375,837
|
24.0%
|
|
Blended Red
|
1,484,229,074
|
1,873,111,178
|
26.2%
|
|
Blended White
|
269,699,000
|
224,442,537
|
-16.8%
|
|
Blended Blush/Rosé
|
116,654,096
|
572,490,682
|
390.8%
|
|
Pinot Grigio/Gris
|
1,186,387,151
|
1,344,404,899
|
13.3%
|
|
Pinot Noir
|
936,198,719
|
1,103,399,934
|
17.9%
|
|
Sauvignon Blanc
|
750,168,540
|
999,545,527
|
33.2%
|
|
Merlot
|
861,008,487
|
696,156,889
|
-19.1%
|
|
Moscato/Muscat
|
702,266,966
|
631,697,229
|
-10.0%
|
|
White Zinfandel
|
346,619,307
|
265,179,467
|
-23.5%
|
|
Malbec
|
289,154,183
|
248,940,782
|
-13.9%
|
|
Riesling
|
269,720,881
|
230,629,592
|
-14.5%
|
|
Zinfandel
|
241,766,953
|
221,075,679
|
-8.6%
|
|
Syrah/Shiraz
|
150,577,588
|
142,528,019
|
-5.3%
|
Sources: Wine Business Monthly. (2016, March). Imported Wines End Year Up 3.9 Percent in Sales. 23(3), 74–75; Wine Business Monthly. (2020, March). Nielsen Table Wine Category Segments. 27(3). 97.
BUYER CONSUMPTION PATTERNS
Population estimates in 2018 indicated that there were approximately 75 million Baby Boomers (age 54–72), 50 million Generation Xers (age 38–53), and 75 million Millennials (age 22–37), three of the most significant segments of U.S. wine buyers.[42], [43] The “matures” (those who grew up during the Great Depression, age 80+) had less impact on the industry due to their age and smaller numbers.[44] There were distinct differences across the generations that were expected to affect wine preferences and consumption patterns for years to come. A 2015 study of the 1972–2012 time period showed that changes in U.S. wine consumption demographics began in the mid-1990s. The American wine consumer shifted from a predominantly older individual with higher income and education to a younger, married, female consumer whose income and educational levels were not significant factors.[45] Exhibit 7 displays the results of a 2018 U.S. alcohol usage survey of 70,000 persons. The percentages represented, by age category, those who had used alcohol in the past month.
|
Age
|
Current Use
|
|---|---|
|
21–25 years
|
66.0%
|
|
26–29 years
|
64.8%
|
|
30–34 years
|
62.0%
|
|
35–39 years
|
60.5%
|
|
40–44 years
|
60.3%
|
|
45–49 years
|
58.3%
|
|
50–54 years
|
59.7%
|
|
55–59 years
|
53.1%
|
|
60–64 years
|
53.1%
|
|
65+ years
|
43.9%
|
Source: Elflein, J. (2019, August 30). Alcohol use in persons aged 12 or older in the U.S. by age 2018. In Statista – The Statistics Portal. Retrieved April 17, 2020, from: https://www.statista.com/statistics/354265/current-binge-heavy-alcohol-u....
Until the early 2000s, wine marketing in the U.S. focused primarily on the Baby Boomers, the large and affluent generation that had been the main wine consuming cohort[46] over the last 25 years. In 1991, a booming economy, a newly found fitness trend, and the November 17, 1991 broadcast of a 60 Minutes television episode helped to launch wine sales growth for decades.[47] The 60 Minutes segment cited studies that indicated red wine reduced the risk of heart attacks. The so-called “French paradox” showed that although the French consume 30 percent more fat per year than did Americans, they had a 40 percent lower incidence of coronary disease. In the report, both French and American doctors suggested that the “paradox” related to the fact that the French drank more wine than Americans. Red wine sales were up 39 percent in 1992. As shown in Exhibits 1 and 8, wine consumption grew steadily since then. Nevertheless, as the median Baby Boomer approached retirement age in 2023, and their wine purchasing seemed to be moderating in both price and volume; alcohol consumption in this cohort was slowing as they aged.[48] U.S. wine sales continued to grow, but not at the rates seen previously.[49]
Exhibit 8
1960–2014 U.S. Wine Consumption Per Capita
Source: Ritchie, H., & Roser, M. (November, 2019). Wine consumption per person, United States, 1960 to 2014. In OurWorldInData.org. Retrieved April 23, 2020, from: https://ourworldindata.org/alcohol-consumption#all-charts-preview.
Generation X was expected to surpass the Baby Boomers in becoming the largest wine purchasers by 2022, but as they were a smaller cohort, that trend was only expected to last until 2027, when the Millennial consumers were forecasted to comprise the majority of the market for wine. In 2015, 42 percent of all wine consumed in the U.S. was by Millennials. However, of those who drank wine a few times a week, Baby Boomers constituted the largest percentage (38 percent), followed by Millennials (30 percent) and Gen Xers (20 percent).[50] Further, 17 percent of Millennials spent more than $20 for a bottle of wine in the previous month, while only five percent of Baby Boomers had done so.[51] Nonetheless, between 2015 and 2019, the number of Millennials that consumed wine at least once a month fell by 26 percent.[52] A positive sign for the industry was that Baby Boomers were likely to work past retirement age, live longer, and drink wine longer than previously expected despite their inevitable journey toward retirement and fixed incomes.[53]
WINE CONSUMER PREFERENCES AND VALUES
The traditional wine branding approach that appealed to Baby Boomers might have been less influential and less valued by younger consumers. This product-focused approach consisted of educating the wine consumer rather than listening to the consumer, relying on product taste and quality and the opinions of experts, factors which did not appear to be as valuable to younger generations. The three-step product-focused approach was as follows:
-
Create a vision (like an artist) to develop tastes;
-
Mobilize those with influence such as the media and critics; and,
-
Have critics and sommeliers educate consumers and encourage them to experience wines.[54]
The appeal of selling terroir (the natural environment of a viticultural site) or the American Viticultural Area (AVA) designation of a wine may not have been as advantageous as they used to be.[55]
Generation X tended to treat the media with irreverence and so preferred wine recommendations from friends, family, and wine reviews.[56] This cohort witnessed great social, economic, and environmental changes as they grew up. They embraced experimentation with new beverage products; however, Gen Xers were nearing the peak of their spending years.[57] Gen Xers also helped to drive the popularity of craft beers that had now been adopted by the Millennials,[58] so maintaining the attraction of this cohort could be more challenging than that of the Baby Boomers. Once-a-week craft beer purchasers tended to be male and either in the Gen X or Millennial cohorts.[59] These cohorts together were expected to account for over 60 percent of craft beer sales in 2020.[60] Gen Xers also seemed to prefer domestic alcohol beverages—higher than both Millennials and Baby Boomers.[61] A 2016 study suggested that they would rather consume alcoholic beverages at home, unlike Millennials who consumed alcohol most often outside the home.[62] Additionally, Gen Xers preferred to consume wine with a meal and not only for special occasions.[63]
The Millennials consumed more spirits and beer than wine in 2019,[64] presenting a challenge to winemakers to attract them as buyers. Contrary to popular opinion that Millennials preferred spirits, beer, or even cannabis to wine, this was not necessarily so. Millennials liked wine but tended to lack the financial capacity to spend heavily on premium wines.[65] These consumers preferred to drink while socializing and celebrating special occasions.[66] The financial recovery of the U.S. economy after 2008 largely served the Baby Boomers and Gen Xers who had jobs and assets; at that time the Millennials were looking for work while also burdened by student debt.[67] Conventional wisdom declared that Millennials were not loyal to brands. One survey indicated that they did not value the opinions of wine critics, and instead, preferred the stories behind wines. They valued the obscure, as their tastes tended to be “rebellious.”[68] Another study of Italian Millennials indicated a strong preference for sustainable wine production practices.[69] A 2019 U.S. consumer perception research study corroborated these findings—Millennials and Gen Z had a favorable perception of organic, sustainable certification programs and logos and were willing to pay more for sustainably produced wine.[70]
ATTRACTING AND RETAINING CUSTOMERS
At the end of 2019, small winery growth opportunities appeared to be in the following areas:
-
Developing creative packaging formats;
-
Using the internet and social media to gain exposure to consumers that lived outside of California; and,
-
Selling to consumers where they live by building brand recognition regionally through “experiences.”[71]
Creative packaging options enabled wineries to attract younger buyers. Boxed wines priced USD 4 and up showed strong growth between 2018 and 2019 (see Exhibit 3). Boxed wines were cost-effective and appealed to the eco-friendly movement.[72] Sales of canned wine, though very small in market share, amounted to USD 69 million in 2019 (739,000 cases in retail outlets).[73] Cans were also portable and lightweight and kinder to the environment than glass, although their shelf lives were shorter than bottled wines.[74] Smaller sizes and entry-level pricing could have been more attractive and proven popular with younger buyers as they represent a smaller financial commitment.[75] Millennials purchased the largest share of canned wines, but Generation X had also shown interest in wine in smaller packaging.[76], [77]
According to Rob McMillan, executive vice-president of Silicon Valley Bank Wine Division, “Across all generations, consumers’ preferences and their price sensitivity to wine are evolving, and that should be changing the way wine is marketed and sold.”[78] Tasting room visits had been the traditional means to introduce wines to consumers, but wine country visits were declining with changing wine consumers and shifting preferences.[79] In fact, tasting room visits in Napa and Sonoma counties had trended lower in the five years leading up to the end of 2019,[80] indicating that the California small winery would need to find other ways to reach customers. As consumers primarily acquired knowledge of wines through tasting experiences, it would be important to advertise differently to the younger generations and avoid the “one bottle” or “one advertisement.”[81] Millennials would likely have been receptive to ads illustrating diversity and those that portrayed wine being consumed in “fun” social events like picnics, game nights, etc.[82] They were interested in wine because it increased their enjoyment of food and time spent with friends and family.[83] Customizable wine club options would also have been important for Millennials who desired more choices, flexibility, and control over wine selections.[84]
Media use also varied across the generations. A 2007 survey of California wine consumers noted that less than half of the Millennial participants read a local newspaper often, whereas most of the study’s Generation X and Baby Boomer consumers had.[85] Additionally, in 2018, 69 percent of U.S. adults used some form of social media.[86] A social media marketing strategy could have been more appropriate for Millennials as an effective tool for building brand awareness. Sharing images, telling stories, connecting with influencers, and enhancing customer service through social media would have helped people engage with the product and create excitement about the wine.[87]
While there was no simple formula for introducing wines to consumers, winemakers were encouraged to take the experiences previously enjoyed in the wine country to entertainment and educational events in various locations to build brand awareness and opinions.[88] The development of focused marketing and advertising tactics would have likely been very important in developing brand awareness and loyalty as research supports the value of generational segmentation for wine brands.[89] Since the Millennial generation would be the largest cohort in 2027, wineries needed to find creative ways to develop flavor profiles that proved popular with this cohort.[90] Additionally, they needed to develop tactics with which Millennials were able to experience wines and be encouraged to spread the word about their favorites.[91] Lastly, wine label designs may have been an important way to differentiate a wine. One study found similarities across the generations when rating wine labels on attractiveness, likelihood of purchase, and eye-catching qualities.[92] A 2012 study, however, found that younger wine consumers were more likely to select wines based on non-traditional images, colors, and names rather than the traditional images of estates and vineyards.[93] The authors suggested that winemakers release wines “with different labels: one for the older, intrinsically oriented buyer, and the other for the spirited, extrinsically oriented Millennial.”[94]
Endnotes