Sergio Canavati, Kimberley Benson, & Shaun Richardson
Date Accepted: February 17, 2018
Keywords: Family Business ● Winery Valuation ● Mergers & Acquisition ● Entrepreneurial Finance ● Business Models ● Negotiation.
Preston “Press” McLean (name disguised at his request) was a successful serial entrepreneur who created an investor group in 2006 to take over a troubled premium winery in Sonoma County. The business model introduced by McLean focused on enhancing the consumers’ experience and outsourced activities that did not directly contribute to the consumers’ experience. McLean’s reforms included rebranding the winery as Morning Star and refurbishing the physical infrastructure and tasting room. At the start of 2012, Morning Star had become highly successful, received positive reviews from the press, expanded its customer base, and ultimately became a popular destination for wine tourists. In January 2012, McLean partnered with an old friend, Michael Foucault, with the intention of diversifying his portfolio as well as replicating the business model that had been successful at Morning Star. They planned to acquire 100 percent of Rara Avis Vineyards, a premium winery in California’s Central Coast. Making the offer thatwould please both the buyer and the seller proved to be quite a challenging endeavor as McLean and Foucault reviewed the potential risks and rewards of acquiring Rara Avis Vineyards.
Preston “Press” McLean basked in the unusually warm spring sunshine one Friday afternoon in May 2012. As CEO of the highly successful Morning Star Winery in Sonoma County, located an hour north of San Francisco, he rarely had the opportunity to leave his office even a few minutes early. One day earlier, McLean had posted a 'For Sale' sign on his 2007 Airstream travel trailer parked in front of his home. In true small-town fashion, the most interested potential buyer lived close by and had watched the sign go up with excitement. McLean prepared to barter with a local winemaker as he stood on the sidewalk of his neighborhood. After a few minutes of discussion about the iconic styling of Airstreams and the upgraded features of this particular anniversary model, McLean’s first bite was set on the hook and reeled in. As he sealed the deal, McLean wished all his business negotiations were that simple.
THE NEW DEAL
Several months earlier, in the midst of the dry and mild winter, an old college friend, Michael Foucault, presented McLean with a business opportunity. Foucault was retired, and he was bored and looking for a new adventure that would fill his days, yet not pull him away from his beloved family or golf. Foucault had made a small fortune as a securities broker in San Francisco during the financial boom of the mid 2000s, enabling him to retire early and comfortably while his only daughter, Beatrice, was still in high school. Beatrice had since graduated and now immersed in her freshman year at California Polytechnic University (Cal Poly) in San Luis Obispo. Foucault had come across an intriguing opportunity through his connections in the finance industry, which he had hoped would materialize into a new business venture. Not far from Cal Poly, situated in the beautiful Paso Robles American Viticultural Area (AVA) of San Luis Obispo County (see the California wine map in Exhibit 1), sat Rara Avis Winery, which had recently been listed for sale.
Exhibit 1. California Wine Map
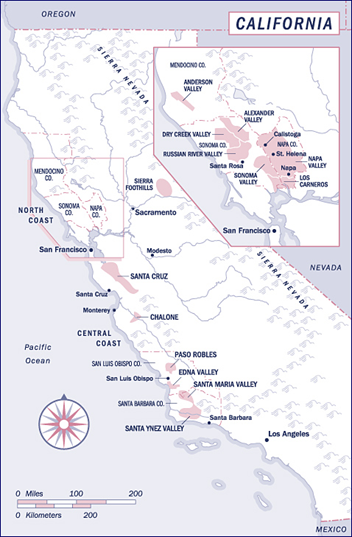
Source: Wine Access. (2012). About California. Retrieved from http://www.wineaccess.com/wine/origin/california.
For Foucault, the location was perfect and the prestige of owning a California winery was irresistible.[i] Foucault immediately thought of his friend McLean, who ran Morning Star, a winery in Sonoma County that Foucault had successfully turned around. “Press, I think I have found the next winery project for us,” said Foucault with great enthusiasm. “You’re the best winery valuation expert I know, and I just can’t see you missing the opportunity to travel down here to check out this winery!” insisted Foucault. Foucault convinced McLean to travel with him to San Luis Obispo and they spent the entire morning touring the property, meeting with the current owners, Wendy and Jim Sloan, and enjoying lunch with the Sloans and their advisors.
While McLean certainly was in the market for another winery opportunity, he didn’t immediately share Foucault’s enthusiasm for the venture. Rara Avis was a four-hour drive from McLean’s home, separated by some of the busiest freeways in California. “I would be responsible for the day-to-day management of the winery and your involvement would be limited to providing guidance and consulting,” said Foucault. “Imagine taking over Rara Avis and turning it into a winery that is praised by wine critics, loved by customers for its experience, and on the radar of high-profile investors just like we did with Morning Star,” added Foucault. One week after their initial visit to the winery, they created a business plan and prepared a formal expression of intent. To McLean’s dismay, Foucault was not the only party passionate about this property; the sellers seemed reticent to rapidly close the deal, and negotiations dragged on for three more months, during which time no other prospective buyer came forward.
WINE CULTURE IN THE U.S.
Great turmoil was a fact of life for the wine industry. The vagaries of the weather and agriculture were complicated by lead times of two to three years from grape to bottled product and the booms and busts of the macro economy. A cultural change throughout the U.S. had recently tempered these risks, most notably since the 1991 airing of a 60 Minutes television news program about 'The French Paradox'. The program purported the health benefits of moderate red wine consumption and a Mediterranean diet. In turn, per capita consumption of wine in the U.S. had increased at an average rate of 1.7 percent per year from 1991 through 2010. Total table wine consumption had also grown at an average annual rate of 2.9 percent during the same period.[ii]
During the economic boom in the early 2000s, growth continued in both quantity and quality. Hip Hop stars rapped about Cristal Champagne from France at USD 300 per bottle.[iii] Celebrities bought wineries and moved to the Napa Valley. Fine wine had become a symbol of success, and the ultimate expression of wealth for the affluent wine aficionado was the ownership of a winery. Between 1991 and 2010, the number of U.S. wineries had grown from 1,623 to 7,626.[iv] However, wine consumption patterns shifted in the aftermath of the 2008 Great Recession. The average U.S. retail price per bottle declined sharply from a peak of about USD 8.50 in 2007 to just under USD 7.50 by the end of 2009.[v] In 2011, the economy began to regain its growth trajectory. In April of 2012, the Silicon Valley Bank (SVB) released its 'State of The Wine Industry Report 2012-2013', an annual publication that was regarded as a widely respected indicator for the wine industry. SVB predicted that in 2013 the industry would see “sales growth of seven to 11 percent” and overall increase in the retail price of wine per bottle, although, “not a return to those prior to the recession.”[vi]
Changing demographics and a generational transition in wine consumers were also expected to influence wine consumption in the near future.[vii] The largest consumer cohort recorded in 2010 census data were the 81.5 million Baby Boomers, those born between 1945 and 1964. The equally populous Millennial Generation (or Generation Y), born between 1978 and 2000, numbered 85.4 million. Numerically, the Millennials were positioned to continue the trend toward greater per capita wine consumption. Generation X, those born between 1965 and 1978, however, had a substantially lower population at 61.0 million. In their report, SVB noted, “standing in the way of a stronger wine recovery today are trends that are lowering the absolute number of the highest spending affluents: those between 35 and 54.”[viii] SVB explained that high spending affluents have the greatest impact on retail spending due to their acquired wealth. Coincidently, when 'The French Paradox' aired in 1991, the mean age of the Baby Boomer generation was 35. SVB reported that beginning in 2011, it had been predicted that the U.S. would see a decline in the absolute number of high spending affluents for a substantial period. As the Baby Boomers spend less in their retirement, there will be insufficient Generation X consumers to replace them, and it will be some time before the Millennials are of sufficient age to fill the spending gap.[ix]
WINE INDUSTRY INVESTORS
The wine industry was capital intensive. Fixed assets, such as vineyard land, vineyard development, winemaking equipment, and barrels required substantial front-loaded investment. Inventory balances ranged from six months to three years of sales, since it often took more than a year from the harvest of grapes in fall, through fermentation and aging, to bottling of the finished product. In addition, another year was required to sell through until the next vintage would be available for sale.[x] Cash flows could be negative for the first three to five years of winery establishment as inventory is built up for a new brand, and depending on the business model, capital assets could represent 1.5 to 3.0 times annual sales.[xi] Yet history had shown that profits were there to be made. In 1977, Andre Mentzelopolous purchased the 650-acre Château Margaux, a prestigious French Winery in Bordeaux, for 15 million USD after a string of poorly reviewed vintages in the region. A separate transaction in 2003 valued the winery at 587 million USD.[xii]
Investing in the wine industry attracted the wealthy primarily because of the capital demands. A unique secondary appeal was the lifestyle benefits: living the life of a landowner with like-minded friends or the prestige of association with a desirable, high quality product. Almost 80 percent of winery owners were 'somewhat' or 'very' unlikely to sell their winery if they could get a better return on the stock market.[xiii] The willingness of wealthy investors to pay above market prices for the wine industry’s highest quality assets had decreased the industry’s rate of return on investments.[xiv] McLean had experienced firsthand the impact of the 'lifestyle' buyer. In October 2011, he found himself in a bidding war over a famous winery in Santa Barbara County, producer of his favorite Pinot Noir. McLean had bid much higher than he planned, but was ultimately outbid, and concluded that the inflated transaction price had been driven by pure desire.
McLean's business history and acumen initially attracted some of these investors to fund Morning Star. They were mostly high net worth individuals ranging in occupations from the dairy industry, to doctors and lawyers, to the beneficiaries of the technology boom. While they were certainly savvy and looking for an internal rate of return (IRR) of 16 percent to 18 percent per year over a ten-year term, a key nonfinancial benefit for investors was that they enjoyed full access to their personal winery. The subsequent success of Morning Star led to new investors constantly knocking on McLean's door, inquiring about his next winery venture. McLean explained the returns he had described to investors:
We (told them) that there would be distributions, but the real returns would be on the sale of the winery, and we (were) not going to distribute earnings for four or five years, and in the end, those dividends (would) not amount to a ton of money compared to the sale price. We are really adding value by building a brand that a big company is going to want to pay a high multiple of EBITDA for. We originally said ten years, but depending on business cycles and when the multiples are high again, we expect that will be sometime in the next five to eight years (after 2012). From a building EBITDA perspective, year 10 or 11 (after founding) seems to be the sweet spot.[xv]
MERGER AND ACQUISITION ACTIVITY IN THE WINE INDUSTRY
In an industry that is predominately privately held, publicly available information was limited. Only one U.S. stand-alone winery was a listed public company in 2012, Willamette Valley Vineyards (WVVI). Exhibit 2 includes selected financial data for WVVI. A few multi-winery corporations were listed, but those often overlapped significantly with other industries. For example, Constellation Brands (STZ) also distributed the widely popular Corona beer. Diageo (DEO), despite owning nationally recognized pre-eminent winery brands such as Sterling and Beaulieu Vineyards, still gained 94 percent of its revenues from distilled spirits and beer.[xvi]
Exhibit 2. Willamette Valley Vineyards – Selected Financial Data (In 1,000's USD, except share data)
|
INCOME STATEMENT
|
|||
|
|
December 31, 2011
|
December 31, 2010
|
December 31, 2009
|
|
Sales
|
15,662.00
|
17,371.00
|
16,564.00
|
|
COGS
|
7,945.00
|
9,679.00
|
8,850.00
|
|
Gross Profit
|
7,717.00
|
7,692.00
|
7,714.00
|
|
SG&A
|
5,470.00
|
6,125.00
|
5,923.00
|
|
EBITDA
|
2,247.00
|
1,567.00
|
1,791.00
|
|
Depreciation
|
747.00
|
720.00
|
674.00
|
|
Other Income/Expenses
|
89.00
|
31.00
|
20.00
|
|
Interest
|
217.00
|
192.00
|
162.00
|
|
Income Tax Expense
|
515.00
|
273.00
|
244.00
|
|
Net Income
|
679.00
|
351.00
|
691.00
|
|
|
|
|
|
|
BALANCE SHEET
|
|||
|
|
|
|
|
|
Assets
|
|
|
|
|
Inventory
|
9,619.00
|
10,712.00
|
12,169.00
|
|
PP&E (net)
|
7,301.00
|
6,244.00
|
6,192.00
|
|
Other
|
7,367.00
|
4,814.00
|
3,944.00
|
|
Total Assets
|
24,287.00
|
21,770.00
|
22,305.00
|
|
Liabilities
|
7,853.00
|
6,203.00
|
7,165.00
|
|
Equity
|
16,434.00
|
15,567.00
|
15,140.00
|
|
|
|
|
|
|
SHARE DATA
|
|
|
|
|
|
|
|
|
|
52-week high
|
2.65
|
3.24
|
2.12
|
|
52-week low
|
3.70
|
3.95
|
4.19
|
|
|
|
|
|
|
Shares Outstanding (12/31/2011)
|
4,892,977.00
|
|
|
|
Source: Yahoo Finance. (2012, July 8). WVVI: Summary for Willamette Valley Vineyards. Retrieved from: http://finance.yahoo.com/q?s=wvvi&ql=1.
|
|||
Most industry observers note that the modern era of deal making in the U.S. wine industry began in 1996. It was in that year when the Texas Pacific Group (TPG), a private equity fund, executed a leveraged buy-out of Beringer Wine Estates (BWE) from Nestlé, who considered BWE’s wineries as non-core assets. In 1997, BWE raised 900 million USD through a successful IPO organized by TPG. By the summer of 2000, towards the end of the 'dotcom' boom, Fosters Brewing Group, an Australian brewing and winemaking giant, approached BWE with a takeover offer. The buy-out was an all-cash deal at valuation multiples of 15.2x Earnings Before Interest, Tax, Depreciation and Amortization (EBITDA) and 3.4x trailing twelve months’ revenues. A summary of the three aforementioned transactions involving BWE is provided in Exhibit 3.[xvii]
Exhibit 3: Beringer Wine Group Transactions
|
Seller
|
Buyer
|
Date of Transaction
|
Annual Case Production (million)
|
Value ($ million)
|
Operating Income ($ million)
|
Revenue ($ million)
|
|---|---|---|---|---|---|---|
|
Nestle
|
Texas Pacific Group
|
January, 1996
|
4.6
|
$371
|
$35
|
$202
|
|
Texas Pacific Group
|
IPO
|
October, 1997
|
5.4
|
$900
|
$56
|
$269
|
|
NASDAQ: BERW
|
Fosters Group
|
August, 2000
|
7.7
|
$1,489
|
$98
|
$438
|
Sources: Adapted from: Laube, J. (2000, August 28). Foster's buys Beringer in blockbuster $1.5 billion deal. The Wine Spectator, Retrieved from: http://www.winespectator.com/webfeature/show/id/Fosters-Buys-Beringer-in-Blockbuster-15-Billion-Deal_20763; Business Wire. (2000, August 3). Beringer Wine Estates announces fourth quarter and fiscal 2000 earnings. Retrieved from the Free Library by Farlex website: http://www.thefreelibrary.com/Beringer+Wine+Estates+Announces+Fourth+Quarter+and+Fiscal+2000...-a063848996; Sinton, P. (1995, November 22). Texas group will buy Beringer, premium vineyards from Nestle. San Francisco Chronicle. Retrieved from: http://www.sfgate.com/business/article/Texas-Group-Will-Buy-Beringer-Premium-Vineyards-3018968.php; and Beringer Wine Estates Holding Inc. Form 10-K. Retrieved from EDGAR Online website: http://edgar.brand.edgar-online.com/EFX_dll/EDGARpro.dll?FetchFilingHTML1?ID=609878&SessionID=g0fHHHPDse-3nl7.
After a brief economic slowdown in 2001-2002, California winery values grew steadily to another peak in 2007. One of the strongest deals that year was the sale of the highly regarded Duckhorn Winery in St. Helena to GI Partners, a private equity group, for an estimated enterprise value of 275 million USD.[xviii] McLean heard speculation that the transaction had been valued at 18 times trailing twelve months EBITDA which he felt “was probably the high-water mark for multiples” in the wine industry. [xix]
Between 2007 and 2010, an average of 10 wineries changed hands each year in the U.S. In contrast 23 wineries were sold in the first eight months of 2011.[xx] The SVB forecast for 2012 predicted “more transitions, sales, and mergers taking place than at any time in memory.”[xxi] Increasing buyer strength was visible in 2011, with a return to higher premiums paid for wineries. As shown in Exhibit 4, five notable transactions occurred in 2011 that provided comparative values for Rara Avis. Cosentino, a Yountville winery located on prime real estate along Highway 29, the main tourist entrance to Napa Valley, was sold out of bankruptcy. Fetzer Winery, located in Mendocino County, north of Sonoma, was a significant publicly traded transaction when purchased by Concha Y Toro, a Chilean wine behemoth. Gary Farrell changed hands from Ascentia to the Vincraft Group. Landmark, near Morning Star in Sonoma County, with a history of six wines making the influential Wine Spectator Top 100 list over the years, was sold to Roll Global after the owners decided to retire. Sloan Estate (no relation to the Sloans of Rara Avis) in Rutherford, Napa Valley, was an outlier. The 40-acre property sold for 40 million USD, and a subsequent sale for the brand and mailing list was for 10 million USD.
Exhibit 4. Selected Winery Transactions in 2011
|
Winery Name
|
Location
|
Annual Case Production
|
Buyer
|
Assets Sold
|
Estimated Transaction Value
|
|---|---|---|---|---|---|
|
Cosentino Winery
|
Napa Valley, Yountville
|
40,000
|
Vintage Wine Estates
|
Brand, winery property, equipment, customer list, inventory and permits
|
$6.9 million
|
|
Fetzer Vineyards
|
Mendocino County
|
3,000,000
|
Viña Concha y Toro (NYSE: VCO)
|
1,060 acres of vineyards, inventory, two wineries, one bottling plant
|
$238 million
|
|
Gary Farrell Winery
|
Sonoma County, Russian River
|
20,000
|
Vincraft
|
Brand, inventory and winery on 23 acres
|
Not Disclosed
|
|
Sloan Estate
|
Napa Valley, Rutherford
|
600
|
Goldin Financial Holdings (HKEX: 530)
|
40 acre property incl. 12 acres of vineyard, home, caves, winery, gardens
|
$40 million
|
|
Sloan Estate
|
Napa Valley, Rutherford
|
600
|
Goldin Financial Holdings (HKEX: 530)
|
Business trade names, customer list and inventory
|
$10 million
|
|
Landmark Vineyards
|
Sonoma County, Sonoma Valley
|
25,000
|
Stewart and Lynda Resnick - Roll Global
|
18 acre property incl. 11 acres of vineyard, winery, brand, inventory
|
$22 million
|
Sources: Adapted from: Quackenbush, J. (2011, January 5). Vintage Wine Estates buys Cosentino Winery, brings back founder. North Bay Business Journal. Retrieved from: http://www.northbaybusinessjournal.com/28311/vintage-wine-estates-buys-defunct-cosentino-winery-brings-back-founder/; Quackenbush, J. (2011, March 1). Fetzer sold to Chilean wine company for $238 million. North Bay Business Journal. Retrieved from: http://www.northbaybusinessjournal.com/32789/chilean-wine-giant-completes-fetzer-purchase/; Quackenbush, J. (2011, April 28). Ascentia sells Gary Farrell brand to Vincraft, Buena Vista to Boisset. North Bay Business Journal. Retrieved from: http://www.northbaybusinessjournal.com/33314/ascentia-sells-gary-farrell-brand-to-vincraft-buena-vista-to-boisset/; Fish, T. (2011, May 3). Buena Vista and Gary Farrell Winery find new owner. Wine Spectator Online. Retrieved from: http://www.winespectator.com/webfeature/show/id/44937; Worobiec, M. (2011, August 3). Fiji Water's owners buy Sonoma's Landmark Vineyards. Wine Spectator Online. Retrieved from: http://www.winespectator.com/webfeature/show/id/45506; Franson, P. (2011, September 21). Real deals revealed at Wine Industry Financial Symposium. Wines and Vines Online. Retrieved from: http://www.winesandvines.com/template.cfm?htitle=Winery%20Buyers%20and%20Sellers%20Talk&content=92631§ion=news; Laube, J. (2011, June 20). Napa's Sloan Estate sold. Wine Spectator Online. Retrieved from: http://www.winespectator.com/webfeature/show/id/45247; Goldin Financial Holdings. (2011, June 7). Disclosable transaction, acquisition of assets relating to wine business [Announcement]. Retrieved from: http://www.goldinfinancial.com/sites/default/files/announce/en/07-06-2011.pdf; and Goldin Financial Holdings. (2011, July 27). Disclosable transaction, acquisition of assets relating to trademarks [Announcement]. Retrieved from: http://www.goldinfinancial.com/sites/default/files/announce/en/27-07-2011.pdf.
PRESS MCLEAN AND MORNING STAR WINERY
McLean first experienced ‘wine country life’ at the vacation property his parents owned in Sonoma County, a brief drive north from the family home in Marin County. First a restaurant chain owner, then a real estate developer, McLean had worked on several winery deals and quickly made connections within the wine industry. In 2004, an East Coast investor asked McLean to find a property that would afford his client the prestigious title of winery owner. McLean spent months
researching the market only to ultimately have the investor back out of the deal. However, during the search he had discovered a unique property in a prime location that had seen multiple owners over the years. The winery held a significant treasure – a highly coveted unlimited visitor permit for its tasting room, a permit no longer available in the county. Up until 1990, wineries in Sonoma County had been able to open for business and allow unlimited numbers of guests to visit, taste the wines, take a tour of the facility, and ultimately make purchases. Residents had long been concerned about the impact of wine tourism on the rural quality of life and acted politically to prevent excessive visitor numbers. Wineries opened after 1990 were limited to tours and tastings 'By Appointment Only', which was highly restrictive to gaining new customers and capitalizing on drive-by tourist traffic. Winery tasting permits are tied to the property for which they are originally purchased and are not transferrable to other properties, restricting their availability for new wineries. The property was composed of a small vineyard, production facility, and tasting room, all of which were well worn. McLean envisioned a new winery; a mecca for wine consumers, both luxurious and comfortable, that offered a variety of tasting environments and provided hospitality unlike anything Sonoma County had ever seen. He pooled his resources, hit the streets and utilized his sales skills to solicit investors for his vision of Morning Star.
[Our vision was] to build a wine brand by reaching retail customers directly, rather than from a restaurant wine list or supermarket shelves or some other way... so we asked ourselves what is going to make us special? It wasn't by making the best wine, because that was a qualifier for entry. We had to do that. There are 450 wineries nearby, and if we didn't make great wine, there was no point. The winning strategy had to be something different, which we decided was hospitality, showing people an extraordinary experience by the way we built out the property and by the service we provided.[xxii]
Before Morning Star, the typical business model for Sonoma County wineries was to invest capital in vineyards and winery, hire the most expensive winemaking team that money could buy, and then wait for accolades from the wine press to roll in. McLean had reduced his business model to two components, “making great wine and providing phenomenal, face-to-face customer service.”[xxiii] Everything else was outsourced: vineyard management, bottling, landscaping, shipping, fulfillment, and IT, ensuring that all these aspects of the business were handled by experts in their respective fields.
The company grew rapidly from its opening day in July 2006 despite the onset of the deepest recession in recent history shortly thereafter. Revenues in 2007, the first full year of operations, were a healthy 2 million USD from 5,000 cases of wine, and the fifty to one hundred visitors per day were predominately from guests driving past the prime location. Revenues had grown to 6 million USD from 10,000 cases of wine in 2010. By 2012, a typical Saturday brought in over five hundred visitors. Each guest was welcomed with complimentary valet parking and then ushered by a dedicated host to the most appropriate area of the tasting room for the legendary Morning Star experience. Wholesale distribution was limited initially, but McLean recognized that the market pull for the brand would at some point demand this. A side benefit of a distribution base would also be to gain greater recognition, and potentially increase the value of the business to large winery investors when it came time to sell.
McLean projected that Morning Star was on track to reach revenues of 16 million USD from 23,000 cases in 2016. The winery broke even in 2011, and projected net operating income to reach 35 percent of sales revenue by 2016. EBITDA had been one of McLean's key financial indicators. It showed profitability before the potentially distorting effects of capital asset depreciation, amortization of intangible assets (such as a brand name), interest, and tax.[xxiv] In 2011 EBITDA was 15 percent of sales revenue, compared to the publicly traded beverage industry average of 14 percent. [xxv] The sole stand-alone, publicly traded winery in the U.S., Willamette Valley Vineyards, had averaged 11 percent EBITDA over the three years from 2009 to 2011 (See Exhibit 2). McLean projected that by driving down operating costs, especially customer acquisition costs, 2016 results could achieve EBITDA at 40 percent of sales revenues.[xxvi] McLean was convinced that there was even more untapped potential in the wine industry:
I am looking for other wineries to buy. When the new one is six years old, I can sell the existing one, and start looking again. Running two wineries, if I stagger them by five to six years, works really well. As a founder and a managing partner, my efforts are heavily loaded in the front; putting the concept together, raising the money, financing the whole thing, designing it, permitting it, building it, getting the staff and vision in place.[xxvii]
THE TALE OF RARA AVIS WINERY
Wendy and Jim Sloan had opened the doors to Rara Avis, their family winery, in 1982. The winery would support them and their three children over the next three decades. It had become more than a career; it had been their home and passion. They had looked forward to the growth the business would experience, and the success their children would enjoy as they assumed management and ownership of the family winery. The Sloans’ eldest son, Phillip, had recently taken over the national bottled wine sales at the winery. However, Wendy and Jim now faced a problem common to a family business; they were ready to retire, but none of their children appeared to be interested in fully taking over the firm.
The Sloans first considered the idea of selling the winery in 2009 and brought in an appraisal company to value their assets. Valuation estimates for their various assets are included in Exhibit 5.
Exhibit 5. Rara Avis Asset Valuation, July 2009 (in whole USD)
|
Asset Description
|
Appraised Value
|
|
Winery Building - Including Permits & Sites
|
6,600,000
|
|
Vineyards - Including Land
|
200,000
|
|
Single Family Residence - Excluding Site
|
957,000
|
|
Secondary Residence - Excluding Site
|
68,900
|
|
Residence Sites (2)
|
1,500,000
|
|
Total Real Property Value
|
9,325,900
|
|
Machinery & Equipment
|
370,000
|
|
Total Value
|
9,695,900
|
|
Note: Sales Comparison Approach - "As Is"
|
|
Source: Company Documents
After long deliberations, in July 2011 the Sloans invited expressions of interest at an asking price of 20 million USD. The proposed sale included the brand, equipment, land, buildings, inventory, permits, and licenses. Rara Avis had posted positive operating income in 2010 and 2011. Exhibits 6, 7, and 8 present both actual and forecasted financial statements for 2010-2015, as provided and estimated by the Sloans. The Sloans believed their winery had great potential if placed in the proper hands. “We’re looking for buyers who value this diamond in the rough as much as we do and intend to make the necessary investments to turn it into a great facility and grow the brand name,” said the Sloans.
Exhibit 6. Rara Avis Actual and Forecast Income Statement, 2010 – 2015 (estimated) (in whole USD)
|
|
SLOAN ACTUAL AND FORECAST
|
|||||
|---|---|---|---|---|---|---|
|
|
Actual
|
Actual
|
Forecast
|
Forecast
|
Forecast
|
Forecast
|
|
Fiscal Year
|
2010
|
2011
|
2012
|
2013
|
2014
|
2015
|
|
|
|
|
|
|
|
|
|
REVENUES
|
|
|
|
|
|
|
|
Bottled Wine
|
$2,450,071
|
$3,136,767
|
$4,091,000
|
$5,147,000
|
$6,022,000
|
$6,625,000
|
|
Bulk Wine
|
545,936
|
192,848
|
-
|
-
|
-
|
-
|
|
Events
|
1,226,720
|
967,587
|
1,315,000
|
1,328,000
|
1,341,000
|
1,355,000
|
|
Rent
|
6,000
|
6,000
|
6,000
|
6,000
|
6,000
|
6,000
|
|
Total Revenue
|
4,228,727
|
4,303,202
|
5,412,000
|
6,481,000
|
7,369,000
|
7,986,000
|
|
|
|
|
|
|
|
|
|
Total COGS
|
1,509,887
|
1,641,073
|
1,703,000
|
2,202,000
|
2,531,000
|
2,837,000
|
|
|
|
|
|
|
|
|
|
Total Gross Margin
|
2,718,840
|
2,662,129
|
3,709,000
|
4,279,000
|
4,838,000
|
5,149,000
|
|
|
|
|
|
|
|
|
|
OPERATING EXPENSES
|
|
|
|
|
|
|
|
General & Admin
|
1,274,680
|
1,350,743
|
|
|
|
|
|
Sales & Marketing
|
497,592
|
388,353
|
|
|
|
|
|
Total Operating Expense
|
1,772,272
|
1,739,096
|
2,167,000
|
2,345,000
|
2,522,000
|
2,703,000
|
|
|
|
|
|
|
|
|
|
EBITDA
|
946,568
|
923,033
|
1,542,000
|
1,934,000
|
2,316,000
|
2,446,000
|
|
|
|
|
|
|
|
|
|
Depreciation
|
290,524
|
249,807
|
449,807
|
749,807
|
849,807
|
849,807
|
|
|
|
|
|
|
|
|
|
Operating Income
|
656,044
|
673,226
|
1,092,193
|
1,184,193
|
1,466,193
|
1,596,193
|
|
|
|
|
|
|
|
|
|
OTHER INCOME/(EXPENSE)
|
|
|
|
|
|
|
|
Interest Expense
|
(511,537)
|
(509,423)
|
(817,641)
|
(796,184)
|
(773,584)
|
(749,781)
|
|
Other Income
|
72
|
1,860
|
-
|
-
|
-
|
-
|
|
Total Other Income/(Expense)
|
(511,465)
|
(507,563)
|
(817,641)
|
(796,184)
|
(773,584)
|
(749,781)
|
|
|
|
|
|
|
|
|
|
Corporate Taxes
|
50,603
|
57,982
|
96,093
|
135,803
|
242,413
|
296,244
|
|
|
|
|
|
|
|
|
|
NET INCOME
|
$93,976
|
$107,681
|
$178,459
|
$252,206
|
$450,196
|
$550,168
|
|
|
|
|
|
|
|
|
|
Tax Rate %
|
35%
|
35%
|
35%
|
35%
|
35%
|
35%
|
Exhibit 7. Rara Avis Actual and Forecast Balance Sheet, 2010 – 2015 (estimated) (in whole USD)
|
|
SLOAN ACTUAL AND FORECAST
|
|||||
|---|---|---|---|---|---|---|
|
|
Actual
|
Actual
|
Forecast
|
Forecast
|
Forecast
|
Forecast
|
|
Fiscal Year
|
2010
|
2011
|
2012
|
2013
|
2014
|
2015
|
|
|
|
|
|
|
|
|
|
ASSETS
|
|
|
|
|
|
|
|
Current Assets
|
|
|
|
|
|
|
|
Cash & Equivalents
|
$7,398
|
$421,335
|
$4,223,719
|
$1,879,663
|
$970,277
|
$1,375,540
|
|
Accounts Receivable
|
202,818
|
380,591
|
378,840
|
453,670
|
515,830
|
559,020
|
|
Inventory
|
5,401,949
|
5,915,122
|
4,870,800
|
5,832,900
|
6,632,100
|
7,187,400
|
|
Prepaid Expenses
|
3,195,506
|
2,575,526
|
2,600,000
|
2,600,000
|
2,600,000
|
2,600,000
|
|
Total Current Assets
|
8,807,671
|
9,292,574
|
12,073,359
|
10,766,233
|
10,718,207
|
11,721,960
|
|
|
|
|
|
|
|
|
|
Land
|
703,573
|
703,573
|
703,573
|
703,573
|
703,573
|
703,573
|
|
Vineyard
|
67,618
|
67,618
|
67,618
|
67,618
|
67,618
|
67,618
|
|
Equipment
|
3,060,599
|
3,060,599
|
4,060,599
|
5,060,599
|
5,060,599
|
5,060,599
|
|
Buildings & Improvements
|
6,738,265
|
6,739,251
|
6,739,251
|
7,739,251
|
8,739,251
|
8,739,251
|
|
Total Property, Plant & Equipment
|
10,570,055
|
10,571,041
|
11,571,041
|
13,571,041
|
14,571,041
|
14,571,041
|
|
|
|
|
|
|
|
|
|
Less: Accumulated Depreciation
|
6,257,929
|
6,507,736
|
6,957,543
|
7,707,350
|
8,557,157
|
9,406,964
|
|
Net Property, Plant & Equipment
|
4,312,126
|
4,063,305
|
4,613,498
|
5,863,691
|
6,013,884
|
5,164,077
|
|
|
|
|
|
|
|
|
|
Goodwill
|
114,461
|
94,753
|
75,753
|
56,753
|
37,753
|
18,753
|
|
|
|
|
|
|
|
|
|
TOTAL ASSETS
|
$13,234,258
|
$13,450,632
|
$16,762,610
|
$16,686,677
|
$16,769,844
|
$16,904,790
|
|
|
|
|
|
|
|
|
|
LIABILITIES & STOCKHOLDER'S EQUITY
|
|
|
|
|
|
|
|
Current Liabilities
|
|
|
|
|
|
|
|
Accounts Payable/Accrued Expense
|
$265,033
|
$407,478
|
$432,960
|
$518,480
|
$589,520
|
$638,880
|
|
Short-Term Debt
|
4,829,770
|
4,850,000
|
4,850,000
|
4,850,000
|
4,850,000
|
4,850,000
|
|
Current Portion of Long-Term Debt
|
140,016
|
140,016
|
140,016
|
140,016
|
140,016
|
140,016
|
|
Accrued Liabilities
|
29,920
|
43,191
|
54,120
|
64,810
|
73,690
|
79,860
|
|
Total Current Liabilities
|
5,264,739
|
5,440,685
|
5,477,096
|
5,573,306
|
5,653,226
|
5,708,756
|
|
|
|
|
|
|
|
|
|
Long-Term Debt
|
|
|
|
|
|
|
|
Term Loan A
|
5,072,485
|
5,005,232
|
4,602,340
|
4,177,991
|
3,731,042
|
3,260,290
|
|
Term Loan B
|
|
|
|
|
|
|
|
Mezzanine
|
|
|
3,500,000
|
3,500,000
|
3,500,000
|
3,500,000
|
|
Total Long-Term Debt
|
5,072,485
|
5,005,232
|
8,102,340
|
7,677,991
|
7,231,042
|
6,760,290
|
|
|
|
|
|
|
|
|
|
Stockholder's Equity
|
|
|
|
|
|
|
|
Capital Stock
|
1,472,455
|
1,472,455
|
1,472,455
|
1,472,455
|
1,472,455
|
1,472,455
|
|
Retained Earnings
|
1,424,579
|
1,532,260
|
1,710,719
|
1,962,925
|
2,413,121
|
2,963,289
|
|
Total Stockholder's Equity
|
2,897,034
|
3,004,715
|
3,183,174
|
3,435,380
|
3,885,576
|
4,435,744
|
|
|
|
|
|
|
|
|
|
TOTAL LIABILITIES & EQUITY
|
$13,234,258
|
$13,450,632
|
$16,762,610
|
$16,686,677
|
$16,769,844
|
$16,904,790
|
Exhibit 8. Rara Avis Actual and Forecast Statement of Cash Flows, 2010 – 2015 (estimated) (in whole USD)
|
|
SLOAN ACTUAL AND FORECAST
|
||||
|---|---|---|---|---|---|
|
|
Actual
|
Forecast
|
Forecast
|
Forecast
|
Forecast
|
|
Fiscal Year
|
2011
|
2012
|
2013
|
2014
|
2015
|
|
|
|
|
|
|
|
|
Net Income
|
$107,681
|
$178,459
|
$252,206
|
$450,196
|
$550,168
|
|
|
|
|
|
|
|
|
Depreciation
|
249,807
|
449,807
|
749,807
|
849,807
|
849,807
|
|
|
|
|
|
|
|
|
Operating Activities
|
|
|
|
|
|
|
Accounts Receivable
|
(177,773)
|
1,751
|
(74,830)
|
(62,160)
|
(43,190)
|
|
Inventory
|
(513,173)
|
1,044,322
|
(962,100)
|
(799,200)
|
(555,300)
|
|
Prepaid Expenses
|
619,980
|
(24,474)
|
-
|
-
|
-
|
|
Accounts Payable/Accrued Expenses
|
142,445
|
25,482
|
85,520
|
71,040
|
49,360
|
|
Accrued Liabilities
|
13,271
|
10,929
|
10,690
|
8,880
|
6,170
|
|
Total Sources (Uses) of Cash
|
84,750
|
1,058,010
|
(940,720)
|
(781,440)
|
(542,960)
|
|
Net Cash Flow from Operating Activities
|
442,238
|
1,686,276
|
61,293
|
518,563
|
857,015
|
|
|
|
|
|
|
|
|
Investing Activities
|
|
|
|
|
|
|
Land
|
-
|
-
|
-
|
-
|
-
|
|
Vineyard
|
-
|
-
|
-
|
-
|
-
|
|
Equipment
|
-
|
(1,000,000)
|
(1,000,000)
|
-
|
-
|
|
Building and Improvements
|
(986)
|
-
|
(1,000,000)
|
(1,000,000)
|
-
|
|
Goodwill
|
19,708
|
19,000
|
19,000
|
19,000
|
19,000
|
|
Net Cash Flow from Investing Activities
|
18,722
|
(981,000)
|
(1,981,000)
|
(981,000)
|
19,000
|
|
|
|
|
|
|
|
|
Financing Activities
|
|
|
|
|
|
|
Change in Notes Payable (Revolver)
|
20,230
|
-
|
-
|
-
|
-
|
|
Change in Term Loan A
|
(67,253)
|
(402,892)
|
(424,349)
|
(446,949)
|
(470,752)
|
|
Change in Term Loan B
|
|
|
|
|
|
|
Proceeds from Mezzanine Financing
|
-
|
3,500,000
|
-
|
-
|
-
|
|
Proceeds from Equity Investment
|
|
|
|
|
|
|
Net Cash Flow from Financing Activities
|
(47,023)
|
3,097,108
|
(424,349)
|
(446,949)
|
(470,752)
|
|
|
|
|
|
|
|
|
Total Increase (Decrease) in Cash
|
413,937
|
3,802,384
|
(2,344,056)
|
(909,386)
|
405,263
|
|
|
|
|
|
|
|
|
Cash at Beginning of Period
|
7,398
|
421,335
|
4,223,719
|
1,879,663
|
970,277
|
|
|
|
|
|
|
|
|
Cash at End of Period
|
$421,335
|
$4,223,719
|
$1,879,663
|
$970,277
|
$1,375,540
|
The property comprised sixteen acres, of which six were planted with the Sangiovese grape variety. The Rara Avis wine portfolio ranged across three price points starting with the 'Sparrow' premium wine brand that retailed at USD 7 – USD 8 per bottle, then moving to the core Rara Avis products at USD 15 to USD 25 per bottle and finally up to the super-luxury 'Cassowary' wines starting at USD 90 per bottle. The brand itself had strength in the marketplace, with 28 percent year-over-year revenue growth in bottled wine sales and volume growth from 24,000 cases to 37,000 cases in 2011.
With the wine grape harvest only occurring once per year in the fall, it is typical to have multiple vintages of the same wine-type in inventory: the most recent vintage in barrel in the winery, the second most recent vintage bottled in the warehouse awaiting release, and the third most recent vintage may be with distributors in the marketplace. Significant activities occur in trading of bulk wines between harvests, where wineries with excess raw materials can profit from unfinished wine, rather than waiting for the complete production cycle. In addition, wineries with insufficient inventory can purchase 'ready-made' bulk wines for bottling and labeling under their own brand. The Sloans had developed a 'negotiant' business, buying bulk wines early in the inventory cycle, immediately after the harvest, and either selling or bottling as required. They confided to McLean that wines made traditionally, that is, growing or buying grapes, fermenting, aging, and bottling the wine, would typically only make up 30 percent of their sales, primarily the Rara Avis and Cassowary brands. Grapes for these wines were sourced from numerous growers in the county. The remaining wines were sourced from the bulk marketplace and bottled as needed. As such, the winery could have an average inventory age of bulk and bottled wines of only 13 months, composed of an average age of 30 months for the traditionally made wines, but only six months for wines sourced from the bulk market.
In 2010, Rara Avis derived 58 percent of revenues from bottled wine sales and 29 percent from public and private wine-oriented events at the winery, such as tastings, dinners, and weddings. The remainder had come from bulk wine sales and rental income from the second house on the property. In 2011, event revenues fell by 21 percent, but growth in bottled wine sales more than made up for this, increasing total revenue for the year. During that year the Sloans had booked multiple events into the future and were expecting to see revenue growth return in 2012. As Phillip continued to expand national distribution, the Sloans forecasted substantial bottled wine revenue growth for 2012 to 2015 (see Exhibit 5). Although excess bulk wines had been sold to other wineries in both 2010 and 2011, the Sloans estimated increasing case sales would allow all wine currently in bulk to be sold as packaged product in future years.
As a family winery, financing had always been difficult to secure, and the couple anticipated much needed repairs and equipment upgrades that would occur over the next several years. “Michael, the winery looks tired and the equipment is not up to the level necessary to make high quality wine,” said McLean. “We would need to invest at least 1 million USD during the next two years to upgrade the machinery and equipment and an additional 1 million USD in revamping the buildings within the next three years,” added McLean. To fund these investments, the Sloans were exploring options for an interest-only loan of 3.5 million USD over ten years with an 11 percent interest rate per year. Bank financing consisted of a term loan with ten years remaining that they had refinanced on January 1st, 2012 at a rate of 5.2 percent per year. Working capital was provided from a line of credit at a rate of 3.6 percent locked in for five years. The line of credit was secured by inventory and accounts receivable and had a cap of 5 million USD.
A VISION FOR RARA AVIS
Based on Morning Star’s 10-year exit strategy model, McLean and Foucault formulated their own financial projections for Rara Avis, which are shown in Exhibits 9, 10, and 11. In contrast to Foucault’s predominately sentimental desire to be close to his daughter, McLean saw real financial value in the location of Rara Avis. Within minutes from downtown Paso Robles, and within the city limits, Rara Avis held an unlimited visitor permit, no longer issued by the city, for similar reasons to those of Sonoma County. Although the model had never been tested in this region, the permit would allow McLean and Foucault to build a Morning Star model in San Luis Obispo County. However, while Sonoma County was known for being a wine tasting epicenter, San Luis Obispo County tourism was more diverse, ranging across interests and demographics. Sonoma County typically drew over 7 million tourists each year, largely due to the wine industry and its offerings. San Luis Obispo County attracted approximately 8.3 million tourists each year; however, only 1.2 million, or less than 15 percent, came for wine related travel.[xxviii],[xxix]
Exhibit 9. McLean Forecast Income Statement, 2012 – 2021 (estimated) (in whole USD)
|
|
MCLEAN FORECAST
|
|||||||||
|---|---|---|---|---|---|---|---|---|---|---|
|
|
Forecast
|
Forecast
|
Forecast
|
Forecast
|
Forecast
|
Forecast
|
Forecast
|
Forecast
|
Forecast
|
Forecast
|
|
Fiscal Year
|
2012
|
2013
|
2014
|
2015
|
2016
|
2017
|
2018
|
2019
|
2020
|
2021
|
|
|
|
|
|
|
|
|
|
|
|
|
|
REVENUES
|
|
|
|
|
|
|
|
|
|
|
|
Bottled Wine
|
$4,091,000
|
$5,147,000
|
$6,022,000
|
$6,625,000
|
$7,618,750
|
$8,761,563
|
$10,075,797
|
$11,587,166
|
$13,325,241
|
$15,324,028
|
|
Bulk Wine
|
-
|
-
|
-
|
-
|
-
|
-
|
-
|
-
|
-
|
-
|
|
Events
|
1,315,000
|
1,328,000
|
1,341,000
|
1,355,000
|
1,558,250
|
1,791,988
|
2,060,786
|
2,369,903
|
2,725,389
|
3,134,197
|
|
Rent
|
6,000
|
6,000
|
6,000
|
6,000
|
6,000
|
6,000
|
6,000
|
6,000
|
6,000
|
6,000
|
|
Total Revenue
|
5,412,000
|
6,481,000
|
7,369,000
|
7,986,000
|
9,183,000
|
10,559,550
|
12,142,583
|
13,963,070
|
16,056,630
|
18,464,225
|
|
|
|
|
|
|
|
|
|
|
|
|
|
Total COGS
|
2,706,000
|
3,140,500
|
3,500,275
|
3,673,560
|
4,059,180
|
4,490,236
|
4,971,850
|
5,509,657
|
6,109,844
|
6,779,187
|
|
|
|
|
|
|
|
|
|
|
|
|
|
Total Gross Margin
|
2,706,000
|
3,340,500
|
3,868,725
|
4,312,440
|
5,123,820
|
6,069,314
|
7,170,732
|
8,453,413
|
9,946,787
|
11,685,038
|
|
|
|
|
|
|
|
|
|
|
|
|
|
OPERATING EXPENSES
|
|
|
|
|
|
|
|
|
|
|
|
General & Admin
|
2,946,600
|
3,210,500
|
3,316,050
|
3,354,120
|
3,247,344
|
3,061,525
|
2,890,610
|
2,623,646
|
2,682,370
|
2,881,155
|
|
Sales & Marketing
|
811,800
|
972,150
|
1,031,660
|
1,118,040
|
1,172,652
|
1,224,610
|
1,271,869
|
1,311,823
|
1,490,206
|
1,525,317
|
|
Total Operating Expense
|
3,758,400
|
4,182,650
|
4,347,710
|
4,472,160
|
4,419,996
|
4,286,134
|
4,162,479
|
3,935,469
|
4,172,576
|
4,406,472
|
|
|
|
|
|
|
|
|
|
|
|
|
|
EBITDA
|
(1,052,400)
|
(842,150)
|
(478,985)
|
(159,720)
|
703,824
|
1,783,179
|
3,008,253
|
4,517,944
|
5,774,211
|
7,278,566
|
|
|
|
|
|
|
|
|
|
|
|
|
|
Depreciation
|
464,648
|
744,648
|
1,024,648
|
1,304,648
|
1,384,648
|
1,190,648
|
990,648
|
790,648
|
590,648
|
590,648
|
|
|
|
|
|
|
|
|
|
|
|
|
|
Operating Income
|
(1,517,048)
|
(1,586,798)
|
(1,503,633)
|
(1,464,368)
|
(680,824)
|
592,532
|
2,017,606
|
3,727,296
|
5,183,563
|
6,687,918
|
|
|
|
|
|
|
|
|
|
|
|
|
|
OTHER INCOME/(EXPENSE)
|
|
|
|
|
|
|
|
|
|
|
|
Interest Expense
|
(615,935)
|
(768,895)
|
(716,278)
|
(898,556)
|
(914,043)
|
(911,794)
|
(875,974)
|
(806,497)
|
(687,523)
|
(644,959)
|
|
Other Income
|
-
|
-
|
-
|
-
|
-
|
-
|
-
|
-
|
-
|
-
|
|
Total Other Income/(Expense)
|
(615,935)
|
(768,895)
|
(716,278)
|
(898,556)
|
(914,043)
|
(911,794)
|
(875,974)
|
(806,497)
|
(687,523)
|
(644,959)
|
|
|
|
|
|
|
|
|
|
|
|
|
|
Corporate Taxes
|
-
|
-
|
-
|
-
|
-
|
-
|
-
|
-
|
-
|
-
|
|
|
|
|
|
|
|
|
|
|
|
|
|
NET INCOME
|
$(2,132,983)
|
$(2,355,692)
|
$(2,219,910)
|
$(2,362,924)
|
$(1,594,867)
|
$(319,262)
|
$1,141,632
|
$2,920,799
|
$4,496,040
|
$6,042,959
|
Exhibit 10. McLean Forecast Balance Sheet, 2012 – 2021 (estimated) (in whole USD)
|
MCLEAN FORECAST
|
||||||||||
|---|---|---|---|---|---|---|---|---|---|---|
|
|
Forecast
|
Forecast
|
Forecast
|
Forecast
|
Forecast
|
Forecast
|
Forecast
|
Forecast
|
Forecast
|
Forecast
|
|
Fiscal Year
|
2012
|
2013
|
2014
|
2015
|
2016
|
2017
|
2018
|
2019
|
2020
|
2021
|
|
|
|
|
|
|
|
|
|
|
|
|
|
ASSETS
|
|
|
|
|
|
|
|
|
|
|
|
Current Assets
|
|
|
|
|
|
|
|
|
|
|
|
Cash & Equivalents
|
$1,314,375
|
$192,857
|
$376,558
|
$1,819,839
|
$1,047,371
|
$681,009
|
$381,892
|
$448,073
|
$153,094
|
$143,529
|
|
Accounts Receivable
|
216,480
|
259,240
|
294,760
|
319,440
|
367,320
|
422,382
|
485,703
|
558,523
|
642,265
|
738,569
|
|
Inventory
|
3,608,000
|
5,400,833
|
5,833,792
|
6,122,600
|
6,765,300
|
7,483,727
|
8,286,417
|
9,182,762
|
10,183,073
|
11,298,646
|
|
Prepaid Expenses
|
1,623,600
|
1,944,300
|
2,210,700
|
2,395,800
|
2,754,900
|
3,167,865
|
3,642,775
|
4,188,921
|
4,816,989
|
5,539,267
|
|
Total Current Assets
|
6,762,455
|
7,797,230
|
8,715,810
|
10,657,679
|
10,934,891
|
11,754,982
|
12,796,786
|
14,378,278
|
15,795,421
|
17,720,011
|
|
|
|
|
|
|
|
|
|
|
|
|
|
Land
|
1,700,000
|
1,700,000
|
1,700,000
|
1,700,000
|
1,700,000
|
1,700,000
|
1,700,000
|
1,700,000
|
1,700,000
|
1,700,000
|
|
Vineyard
|
200,000
|
200,000
|
200,000
|
200,000
|
200,000
|
200,000
|
200,000
|
200,000
|
200,000
|
200,000
|
|
Equipment
|
1,370,000
|
2,770,000
|
3,170,000
|
3,570,000
|
3,970,000
|
4,370,000
|
4,770,000
|
5,170,000
|
5,570,000
|
5,970,000
|
|
Buildings & Improvements
|
7,625,900
|
8,625,900
|
9,625,900
|
9,625,900
|
9,625,900
|
9,625,900
|
9,625,900
|
9,625,900
|
9,625,900
|
9,625,900
|
|
Total Property, Plant & Equipment
|
10,895,900
|
13,295,900
|
14,695,900
|
15,095,900
|
15,495,900
|
15,895,900
|
16,295,900
|
16,695,900
|
17,095,900
|
17,495,900
|
|
|
|
|
|
|
|
|
|
|
|
|
|
Less: Accumulated Depreciation
|
464,648
|
1,209,295
|
2,233,943
|
3,538,590
|
4,923,238
|
6,113,885
|
7,104,533
|
7,895,180
|
8,485,828
|
9,076,475
|
|
Net Property, Plant & Equipment
|
10,431,253
|
12,086,605
|
12,461,958
|
11,557,310
|
10,572,663
|
9,782,015
|
9,191,368
|
8,800,720
|
8,610,073
|
8,419,425
|
|
|
|
|
|
|
|
|
|
|
|
|
|
Goodwill
|
-
|
-
|
-
|
-
|
-
|
-
|
-
|
-
|
-
|
-
|
|
|
|
|
|
|
|
|
|
|
|
|
|
TOTAL ASSETS
|
$17,193,708
|
$19,883,835
|
$21,177,768
|
$22,214,989
|
$21,507,554
|
$21,536,997
|
$21,988,154
|
$23,178,998
|
$24,405,493
|
$26,139,436
|
|
|
|
|
|
|
|
|
|
|
|
|
|
LIABILITIES & STOCKHOLDER'S EQUITY
|
|
|
|
|
|
|
|
|
|
|
|
Current Liabilities
|
|
|
|
|
|
|
|
|
|
|
|
Accounts Payable/Accrued Expense
|
$270,600
|
$324,050
|
$368,450
|
$399,300
|
$459,150
|
$527,978
|
$607,129
|
$698,153
|
$802,832
|
$923,211
|
|
Short-Term Debt
|
-
|
5,500,000
|
4,500,000
|
2,000,000
|
4,000,000
|
5,500,000
|
6,000,000
|
5,500,000
|
3,500,000
|
4,000,000
|
|
Current Portion of Long-Term Debt
|
-
|
-
|
-
|
-
|
-
|
-
|
-
|
-
|
-
|
-
|
|
Accrued Liabilities
|
54,120
|
64,810
|
73,690
|
79,860
|
91,830
|
105,596
|
121,426
|
139,631
|
160,566
|
184,642
|
|
Total Current Liabilities
|
324,720
|
5,888,860
|
4,942,140
|
2,479,160
|
4,550,980
|
6,133,573
|
6,728,555
|
6,337,784
|
4,463,398
|
5,107,853
|
|
|
|
|
|
|
|
|
|
|
|
|
|
Long-Term Debt
|
|
|
|
|
|
|
|
|
|
|
|
Term Loan A
|
5,501,970
|
4,983,650
|
4,444,213
|
3,882,798
|
3,298,510
|
2,690,417
|
2,057,550
|
1,398,899
|
713,413
|
-
|
|
Term Loan B
|
-
|
-
|
-
|
6,424,540
|
5,824,440
|
5,198,644
|
4,546,054
|
3,865,521
|
3,155,848
|
2,415,789
|
|
Mezzanine
|
3,500,000
|
3,500,000
|
3,500,000
|
3,500,000
|
3,500,000
|
3,500,000
|
3,500,000
|
3,500,000
|
3,500,000
|
-
|
|
Total Long-Term Debt
|
9,001,970
|
8,483,650
|
7,944,213
|
13,807,338
|
12,622,950
|
11,389,062
|
10,103,604
|
8,764,420
|
7,369,262
|
2,415,789
|
|
|
|
|
|
|
|
|
|
|
|
|
|
Stockholder's Equity
|
|
|
|
|
|
|
|
|
|
|
|
Capital Stock
|
10,000,000
|
10,000,000
|
15,000,000
|
15,000,000
|
15,000,000
|
15,000,000
|
15,000,000
|
15,000,000
|
15,000,000
|
15,000,000
|
|
Retained Earnings
|
(2,132,983)
|
(4,488,675)
|
(6,708,585)
|
(9,071,509)
|
(10,666,376)
|
(10,985,637)
|
(9,844,005)
|
(6,923,206)
|
(2,427,166)
|
3,615,793
|
|
Total Stockholder's Equity
|
7,867,017
|
5,511,325
|
8,291,415
|
5,928,491
|
4,333,624
|
4,014,363
|
5,155,995
|
8,076,794
|
12,572,834
|
18,615,793
|
|
|
|
|
|
|
|
|
|
|
|
|
|
TOTAL LIABILITIES & EQUITY
|
$17,193,708
|
$19,883,835
|
$21,177,768
|
$22,214,989
|
$21,507,554
|
$21,536,997
|
$21,988,154
|
$23,178,998
|
$24,405,493
|
$26,139,436
|
Exhibit 11. McLean Forecast Statement of Cash Flows, 2012 – 2021 (estimated) (in whole USD)
|
|
MCLEAN FORECAST
|
|||||||||
|
|
Forecast
|
Forecast
|
Forecast
|
Forecast
|
Forecast
|
Forecast
|
Forecast
|
Forecast
|
Forecast
|
Forecast
|
|
Fiscal Year
|
2012
|
2013
|
2014
|
2015
|
2016
|
2017
|
2018
|
2019
|
2020
|
2021
|
|
|
|
|
|
|
|
|
|
|
|
|
|
Net Income
|
$(2,132,983)
|
$(2,355,692)
|
$(2,219,910)
|
$(2,362,924)
|
$(1,594,867)
|
$(319,262)
|
$1,141,632
|
$2,920,799
|
$4,496,040
|
$6,042,959
|
|
|
|
|
|
|
|
|
|
|
|
|
|
Depreciation
|
464,648
|
744,648
|
1,024,648
|
1,304,648
|
1,384,648
|
1,190,648
|
990,648
|
790,648
|
590,648
|
590,648
|
|
|
|
|
|
|
|
|
|
|
|
|
|
Operating Activities
|
|
|
|
|
|
|
|
|
|
|
|
Accounts Receivable
|
(216,480)
|
(42,760)
|
(35,520)
|
(24,680)
|
(47,880)
|
(55,062)
|
(63,321)
|
(72,819)
|
(83,742)
|
(96,304)
|
|
Inventory
|
(3,608,000)
|
(1,792,833)
|
(432,958)
|
(288,808)
|
(642,700)
|
(718,427)
|
(802,690)
|
(896,345)
|
(1,000,311)
|
(1,115,573)
|
|
Prepaid Expenses
|
(1,623,600)
|
(320,700)
|
(266,400)
|
(185,100)
|
(359,100)
|
(412,965)
|
(474,910)
|
(546,146)
|
(628,068)
|
(722,278)
|
|
Accounts Payable/Accrued Expenses
|
270,600
|
53,450
|
44,400
|
30,850
|
59,850
|
68,827
|
79,152
|
91,024
|
104,678
|
120,380
|
|
Accrued Liabilities
|
54,120
|
10,690
|
8,880
|
6,170
|
11,970
|
13,766
|
15,830
|
18,205
|
20,936
|
24,076
|
|
Total Sources (Uses) of Cash
|
(5,123,360)
|
(2,092,153)
|
(681,598)
|
(461,568)
|
(977,860)
|
(1,103,861)
|
(1,245,939)
|
(1,406,081)
|
(1,586,508)
|
(1,789,699)
|
|
Net Cash Flow from Operating Activities
|
(6,791,695)
|
(3,703,198)
|
(1,876,861)
|
(1,519,845)
|
(1,188,079)
|
(232,475)
|
886,341
|
2,305,365
|
3,500,179
|
4,843,907
|
|
|
|
|
|
|
|
|
|
|
|
|
|
Investing Activities
|
|
|
|
|
|
|
|
|
|
|
|
Land
|
(1,700,000)
|
-
|
-
|
-
|
-
|
-
|
-
|
-
|
-
|
-
|
|
Vineyard
|
(200,000)
|
-
|
-
|
-
|
-
|
-
|
-
|
-
|
-
|
-
|
|
Equipment
|
(1,370,000)
|
(1,400,000)
|
(400,000)
|
(400,000)
|
(400,000)
|
(400,000)
|
(400,000)
|
(400,000)
|
(400,000)
|
(400,000)
|
|
Building and Improvements
|
(7,625,900)
|
(1,000,000)
|
(1,000,000)
|
-
|
-
|
-
|
-
|
-
|
-
|
-
|
|
Goodwill
|
-
|
-
|
-
|
-
|
-
|
-
|
-
|
-
|
-
|
-
|
|
Net Cash Flow from Investing Activities
|
(10,895,900)
|
(2,400,000)
|
(1,400,000)
|
(400,000)
|
(400,000)
|
(400,000)
|
(400,000)
|
(400,000)
|
(400,000)
|
(400,000)
|
|
|
|
|
|
|
|
|
|
|
|
|
|
Financing Activities
|
|
|
|
|
|
|
|
|
|
|
|
Change in Notes Payable (Revolver)
|
-
|
5,500,000
|
(1,000,000)
|
(2,500,000)
|
2,000,000
|
1,500,000
|
500,000
|
(500,000)
|
(2,000,000)
|
500,000
|
|
Change in Term Loan A
|
5,501,970
|
(518,320)
|
(539,437)
|
(561,415)
|
(584,288)
|
(608,093)
|
(632,867)
|
(658,651)
|
(685,486)
|
(713,413)
|
|
Change in Term Loan B
|
|
-
|
-
|
6,424,540
|
(600,100)
|
(625,795)
|
(652,591)
|
(680,533)
|
(709,672)
|
(740,059)
|
|
Proceeds from Mezzanine Financing
|
3,500,000
|
-
|
-
|
-
|
-
|
-
|
-
|
-
|
-
|
(3,500,000)
|
|
Proceeds from Equity Investment
|
10,000,000
|
-
|
5,000,000
|
-
|
-
|
-
|
-
|
-
|
-
|
-
|
|
Net Cash Flow from Financing Activities
|
19,001,970
|
4,981,680
|
3,460,563
|
3,363,125
|
815,612
|
266,112
|
(785,458)
|
(1,839,184)
|
(3,395,158)
|
(4,453,472)
|
|
|
|
|
|
|
|
|
|
|
|
|
|
Total Increase (Decrease) in Cash
|
1,314,375
|
(1,121,518)
|
183,702
|
1,443,280
|
(772,467)
|
(366,363)
|
(299,117)
|
66,181
|
(294,979)
|
(9,565)
|
|
|
|
|
|
|
|
|
|
|
|
|
|
Cash at Beginning of Period
|
|
1,314,375
|
192,857
|
376,558
|
1,819,839
|
1,047,371
|
681,009
|
381,892
|
448,073
|
153,094
|
|
|
|
|
|
|
|
|
|
|
|
|
|
Cash at End of Period
|
$1,314,375
|
$192,857
|
$376,558
|
$1,819,839
|
$1,047,371
|
$681,009
|
$381,892
|
$448,073
|
$153,094
|
$143,529
|
Based on McLean and Foucault's assessment of the current wine market the partners expected 15 percent total annual revenue growth over the ten-year period. “I think that we could expect Rara Avis’ turnaround process to follow a trajectory similar to that of Morning Star, maybe with slightly lower prices and higher case volume,” reflected McLean. Foucault nodded his head signaling agreement with McLean’s observation. “In that case, it is reasonable to project steady revenue growth during the next ten years, which could be divided into two different five-year phases: an investment phase and a building phase,” responded Foucault. The investing phase involved negative cash flows and negative earnings. The building phase allowed the results of the early investments in the facility to pay off while continuing to build the brand and sales to a high net operating income value. Initial funding would be part debt with a similarly structured term loan, and part equity from investors. During the investing phase, additional debt and equity would be required for working capital to increase inventory, to improve wine quality, and to acquire customers. The debt to equity ratio would peak in year six at 55 percent, declining to 35 percent in year 10.
McLean planned to source grapes from select vineyards in the area and maintain all winemaking processes in-house to regulate quality. The over 60 percent gross margin that the Sloans had enjoyed would drop to 50 percent during the investing phase, due to the increased cost of grapes and new winemaking practices. Gross margin would then slowly return to 60 percent during the building phase of the project as a greater proportion of direct-to-consumer (i.e. higher priced) sales occurred.[xxx] Similar to the Morning Star model, the new Rara Avis would hold on average a 30-month supply of bulk and bottled wine.[xxxi]
McLean and Foucault concurred with the Sloans that 4 million USD was needed for capital investments over the initial three years, to bring the property up to the luxury standards necessary to attract a well-heeled clientele. They also planned for an ongoing annual budget of USD 400,000 for equipment thereafter. Included in this would be the purchase each year of up to 300 new oak barrels, which would contribute to the quality of the wine. These currently cost USD 1,000 each, and only held 25 cases of wine.
Morning Star had proved that managing operating expenses was the key to success. For the model to work these expenses would be initially above values typically found in the industry, but with time would fall to substantially below those values. Industry averages for sales and marketing expenses were typically 20 to 30 percent of gross revenue.[xxxii] During Morning Star’s first full year of operation, 55 percent of total revenues had been spent on sales and marketing with a focused customer acquisition strategy. McLean had steadily brought this down to 35 percent during the last three years and planned to bring this down further to 17 percent at the end of his ten-year model period. Likewise, general and administrative costs typically ranged from 10 to 15 percent.[xxxiii] Morning Star’s four years of operation had shown a decrease from 26 percent to 19 percent after the initial building of the company, and McLean projected these to fall below 10 percent for the last three years of his ten-year model.
THE OFFER
In May 2012, McLean and Foucault sifted through the prospectus provided by Rara Avis. The presentation was for a family estate with a strong brand, simply seeking a new owner to take over and nurture it to greatness with some additional capital. McLean summarized the winery as “a good business, but [the Sloans] are totally underutilizing the space.”[xxxiv] The brand certainly had some strength, but McLean went on to say that recent sales growth could be because the past two years were “…a good time to be building low priced wines in the wholesale channel anyway.”[xxxv] The buildings were in fair condition, and the equipment was serviceable, but outdated. The asset appraisal from 2009 gave a baseline to the transaction. McLean chuckled to himself when thinking about the bottling-line, which in his opinion was “held together with duct tape and baling wire.” The two general partners certainly realized the site had potential, but they harbored doubts about the wine tourism potential of the region, as well as the ability to effectively leverage the brand. They were also aware that there were no other serious bidders.
“Something tells me that the inventory estimates are not accurate and there’s a smoking mirror here”, McLean told Foucault. Rather than reporting at the lower of market or cost, both bulk wine and finished case goods were reported at final case value. Exhibit 12 shows how the value of bulk wine inventory was estimated based on the final case value rather than the cost of production. Exhibit 13 shows the bottled inventory valued using average market values per gallon rather than what it cost to produce each gallon.
Exhibit 12. Rara Avis Bulk Wine Inventory, February 29, 2012
|
WAREHOUSE BOTTLED INVENTORY
|
|
|
|
|
|---|---|---|---|---|
|
Brand
|
Cases
|
Average Case Value
|
Total Value
|
|
|
Sparrow
|
2,024
|
$32.86
|
$66,515
|
|
|
Rara Avis
|
8,725
|
$59.22
|
$516,653
|
|
|
Cassowary
|
1,086
|
$116.75
|
$126,792
|
|
|
Total Warehouse Bottled Inventory
|
11,835
|
$59.99
|
$709,960
|
|
|
|
|
|
|
|
|
WINERY BOTTLED INVENTORY
|
|
|
|
|
|
|
|
Average
|
|
|
|
Location
|
Cases
|
Case Value
|
Total Value
|
|
|
Taxpaid Winery
|
Undisclosed
|
Undisclosed
|
$295,261
|
|
|
Cellar – Bottled
|
Undisclosed
|
Undisclosed
|
$44,559
|
|
|
Bottling Supplies
|
|
|
$82,615
|
|
|
Total Winery Inventory
|
|
|
$422,435
|
|
|
|
|
|
|
|
|
Total Bottled Inventory Value
|
|
|
$1,132,395
|
|
|
|
|
|
|
|
|
|
|
|
|
|
Exhibit 13. Rara Avis Bottled Inventory, at February 29, 2012
|
Product
|
Program
|
Gallons
|
|---|---|---|
|
Cabernet Sauvignon
|
Cassowary
|
7,658
|
|
Cabernet Sauvignon
|
Rara Avis
|
29,152
|
|
Chardonnay
|
Rara Avis
|
1,562
|
|
Chardonnay
|
Sparrow
|
10,742
|
|
Gewurztraminer
|
Rara Avis
|
1,562
|
|
Merlot
|
Rara Avis
|
2,522
|
|
Merlot
|
Sparrow
|
34,978
|
|
Sangiovese
|
Rara Avis
|
1,200
|
|
Sangiovese - Rose
|
Rara Avis
|
480
|
|
Sherry
|
Rara Avis
|
1,533
|
|
Syrah
|
Rara Avis
|
1,920
|
|
Zinfandel - White
|
Sparrow
|
480
|
|
|
|
|
|
Total
|
|
93,789
|
|
|
|
|
|
Average Value per Gallon
|
|
$14.75
|
|
Total Bulk Inventory Value
|
|
$1,383,388
|
The Sloans saw Rara Avis as the result of the more than thirty years of effort and dedication their family had invested in the business. Thus, nonfinancial factors, such as the ability of Rara Avis to remain a going concern after the sale, also played a role in the negotiation process. For example, Wendy Sloan expressed some hesitation over having Foucault run Rara Avis as general manager, since he not only had no prior experience running a winery, but also had engaged in several heated exchanges with her during the early negotiations in the late winter and early spring of 2012.
Taking into consideration all the risks involved, McLean and Foucault had to formulate an offer for Rara Avis that would satisfy the seller yet would leave sufficient room to generate returns for investors, who would be limited partners in the deal. The partners felt that if they bid low, they would risk offending the Sloans. The opportunity could be lost if the Sloans elected to run the business for a few more years before entering the market again. On the other hand, if they bid too high, every dollar overpaid for Rara Avis would result in a reduced return for McLean and Foucault’s limited partners. For Rara Avis, McLean confessed that the only facet of the deal that kept him up at night was the fear of overpaying. He explained:
I don’t want to look like a chump for spending (the investors’) money badly. We can overpay by a little, that’s okay, because in the end if we’re successful nobody will care. And if it’s not successful it doesn’t matter because people are going to be bummed. But I don’t want to overpay in any significant way; it has to be immaterial.[xxxvi]
Endnotes
[i] American Viticultural Area: An area defined in the USA by Bureau of Alcohol and Tobacco, Tax and Trade Bureau as having significant and unique features for growing grapes. Examples of AVA's include Napa Valley, Sonoma, Paso Robles, etc. International equivalents exist, most notably the French Appellation d'Origine Controllee, which designates such regions as Bordeaux and Burgundy.
[ii] Wine Institute. (2011). Wine consumption in the U.S. Retrieved from: http://www.wineinstitute.org/resources/statistics/article86
[iii] Jay-Z. (2007, July 7). Hard knock life [Video file]. Retrieved from: http://www.universal-music.de/jay-z/videos/detail/video:89765/hard-knock-life
[iv] Wine Institute. (2011, April 19). Number of Californian wineries. Retrieved from: http://www.wineinstitute.org/resources/statistics/article124
[v] Yule, M., Kierath, T., & Wong, C. (2011, February 3). The global wine industry. Morgan Stanley.
[vi] State of the Wine Industry 2012-2013 (Rep.). (2012). St. Helena, CA: Silicon Valley Bank. Retrieved from http://www.svb.com/2012-wine-report/
[vii] U.S. Census Bureau. (2011, May). Age and sex composition: 2010. (Report No. C2010BR-03). Retrieved from http://www.census.gov/prod/cen2010/briefs/c2010br-03.pdf.
[viii] McMillan, op cit.
[ix] Ibid.
[x] MKF Research. (2007, June). Assessment of the profitability and viability of Virginia wineries. Retrieved from https://rga.lis.virginia.gov/Published/2007/HD37/PDF
[xi] MKF Research. (2007, June). Op. Cit.
[xii] Sullivan, P. (2012, July 8). Winemaking lures the wealthy, but not with profits. The New York Times. Retrieved from http://www.nytimes.com/2012/05/26/your-money/winemaking-lures-the-wealthy-but-not-with-profits.html
[xiii] Scott Morton, F. M., & Podolny, J. M. (2002). Love or money? The effects of owner motivation in the California wine industry. Journal of Industrial Economics, 50(4), 431-456.
[xiv] Ibid.
[xv] McLean, P. (2012, May 18). Personal interview.
[xvi] Diaego. (n.d.). Categories. Retrieved from: https://web.archive.org/web/20120403100255/http://www.diageo.com/ensc/ourbrands/categories/pages/default.aspx
[xvii] Multiples: Valuation multiples are the quickest way to value a company, and are useful in comparing similar companies (e.g. comparable company analysis). They attempt to capture many of a firm's operating and financial characteristics (e.g. expected growth) in a single number that can be multiplied by some financial metric (e.g. EBITDA) to yield an enterprise or equity value. Multiples are expressed as a ratio of capital investment to a financial metric attributable to providers of that capital.
[xvii] Warren Buffett, in a note to shareholders in Berkshire Hathaway’s 2000 annual report, said, “References to EBITDA make us shudder." Too many investors focus on earnings before interest, taxes, depreciation and amortization. That makes sense, he said, only if you think capital expenditures are funded by the tooth fairy.[xvii]
[xviii] Zepponi, M. (2011, September). Survey of winery transactions and market expectations. Paper presented at North Bay Business Journal’s Impact Napa Conference.
[xix] McLean, 2012. Op. cit.
[xx] Zepponi, 2012. Op. cit.
[xxi] McMillian, 2012. Op. cit.
[xxii] McLean, 2012, Op. cit.
[xxiii] Ibid.
[xxiv] How to Understand the Jargon, The Guardian, June 13, 2008, Accessed July 22, 2012, http://www.guardian.co.uk/money/2008/jun/14/consumer.affairs.jargon
[xxv] Damodaran, A. (2012, January). Operating and net margins by industry [Data file]. Retrieved from: http://www.stern.nyu.edu/~adamodar/pc/archives/margin10.xls
[xxvi] Morning Star documents.
[xxvii] McLean, 2012. Op. cit.
[xxviii] San Luis Obispo County Visitors and Conference Bureau. (n.d.). Facts and figures. Retrieved from https://web.archive.org/web/20120819104135/http://www.sanluisobispocounty.com/media/facts-figures
[xxix] MKF Research. (2007). Economic impact of wine and winegrapes in the Paso Robles AVA and Greater San Luis Obispo County 2007. Retrieved from http://www.prcity.com/business/pdf/EconomicImpactReport6-2007opt.pdf
[xxx] Higher gross margins in the wine industry are possible by selling more wine Direct To Consumer (DTC), generally at the winery through the tasting room. Additionally, wineries may offer a 'wine club' where periodic shipments of wine are sent to consumers. The alternative to DTC is the wholesale channel, where wines are sold to a distributor in a specific state, who then sells the wine to restaurants and retailers. Sales through the wholesale channel typically show lower gross margins than DTC.
[xxxi] Wines developed different flavors over time. Typically, early release white wines, those that are fresh and fruity such as Sauvignon Blanc, are bottled within three months of fermentation. Late release white whites, with more complex flavors, are often aged in barrels and bottled within nine months of harvest. Red wines contain tannins, chemical compounds that give structure and mouthfeel, and the wines benefit from longer aging, especially in barrels. Lighter-bodied wines such as Pinot Noir and Sangiovese will remain in barrel for 9 to 12 months, and fuller bodied wines such as Cabernet Sauvignon will remain in barrel from 12 to 24 months.
[xxxii] Frank, Rimmernman + Co. LLP. (2008, August 6). Winery accounting and finance for executives. UC Davis Extension course.
[xxxiii] Ibid.
[xxxiv] McLean. 2012. Op. Cit.
[xxxv] McLean. 2012. Op. Cit.
[xxxvi] McLean. 2012. Op. Cit.