Dr. Raymond Lopez
April 14, 2016
Keywords: ● Strategy Implementation ● Family Business ● Small Business ● Succession ● Diversification ● Colli Bolognesi, Northern Italy
Case Overview
This case provides students with an opportunity to learn about the growth of the Indian wine industry over the last two decades. After rapid growth in the late 1990’s and early 2000’s the “Great Recession” affected most of the world. After years of “trading up” the price and quantity ladder for most products, including wine, a “trading down” phenomenon affected consumers in 2008 and 2009. Even though internationalization of the Indian economy resulted in changing tastes and preferences of its consumers, especially with respect to the wine segment of the beverage marketplace, demand for wine declined significantly.
Prior to the “Great Recession” Indian wine production was growing rapidly, due to the entrepreneurial efforts of individuals like Rajeev Samant. He was a native of India who came to the U.S to study at Stanford University and worked for Oracle for only 2 years. He decided to return to his homeland to create a firm that would spearhead wine consumption and production in India.
With the professional assistance of Kerry Damskey, a wine consultant from California, he started Sula wines using 30 acres of family land in Nashik. Together they designed both red and white wine brands that been accepted enthusiastically by consumers in India as well as in Western Europe and North America.
After successfully guiding Sula Vineyards through the “Great Recession” the firm has emerged as the number one producer of premium wines in India. It has also developed a growing “hospitality” operation that complements and enhances its wine business. Currently in early 2013, management is considering how fast to grow over the next 5 years, and how funds should be obtained to support these strategic initiatives. Rajeev has utilized two private equity deals to supplement both short and long-term borrowings. With negative free cash flow, due to rapid expansion of assets, a major challenge is to finance growth while maintaining operating control of the company.
Still basking in the afterglow of the successful 6th annual SulaFest in early February 2013, Sula Vineyards’ management met in April 2013 to discuss how to remain the leading premium-wine producer in India. Held at the winery in early February, SulaFest was an annual two-day event pairing Sula wine and Indian food with a marathon series of rock concerts under the stars. Rajeev Samant (“Rajeev”) and Kerry Damskey (“Kerry”), Sula’s co-founders, held high expectations for Sula’s expanded portfolio of single-varietal brands as they continued to achieve above market-growth rates, all of which would require more consistent quantity and quality of grapes from both owned and contract vineyards. To cope with anticipated future growth, the co-founders knew that further investment in facilities for winemaking and wine tourism would be necessary, but the magnitude and priorities for such investments needed to be worked out.
Since its first plantings of grapes in 1996, Sula’s strategic focus had always been to target India’s emerging quality-wine consumer for its premium wine. As word spread of the quality of Sula’s first vintage, sales picked up, and the company was on its way. Sula had grown with the Indian market and had also been responsible for a good part of that growth. Rajeev utilized his marketing skills to spread the word and stimulate demand for Indian wines, both domestically and internationally.1 Yet domestic wine was the segment hit hardest by customers’ tendencies towards “trading down” in prices paid for wines from 2008 to 2010. Product backed up in the supply chain, all the way to the winery, and Sula had trouble servicing its debt. Still, Sula moved decisively into sustainable wine operations with a number of costly, but important, investments in organic agriculture, energy reduction and water conservation, all considered necessary to sustain its sole base of grape-growing and winemaking operations in Nashik, India. According to the Indian Government Tourist Office, Nashik is located in the northern part of the state of Maharashtra, situated 2,300 feet above sea level, and at a distance of about 171 kilometers (km) from Mumbai and 210 km from Pune.2 Nashik, considered India’s primary wine-growing region, boasted 22 out of India’s 46 wineries. The region was characterized by a tropical climate.
Monsoons were typical from July through September, and the region experienced hot summers and dry, cooler winters. Once the global recession began to abate in 2012, Sula’s diversification strategies included activities in beverage distribution as well as hospitality. Sula leveraged its extensive distribution network to wine imports as well as beer and other beverages. And, in 2012, Sula opened a 32- room Beyond Vineyard facility, supporting extended visitor stays. Located a short 3 km from the winery, it provided a broad variety of facilities for visitors. Each guestroom had a private balcony, with lake and hill view. Other facilities included all day dining available at Café Rose, a conference hall, gymnasium, infinity pool, vino spa and the Red Room for games and just “chilling out.” Sula also opened wine and tapas bars, located in some of India’s largest population centers, such as Mumbai and Goa, with plans to increase their presence in tier II (Chhattisgarh, Orissa, Jammu, Kashmir) and tier III cities (Nasik, Baroda, Trichy, Madurai, each with populations less than one million people) across the Indian subcontinent. Over time, these hospitality activities were expected to contribute to revenues as well as to the incremental growth of the core wine business.3
“Five years ago we had a very extensive strategic planning session, Rajeev.” Kerry said.
I remember traveling from my home in Sonoma County, California just before the Great Recession. At that time, our expectations for company growth, expansion plans and strategic initiatives had to be revised extensively. Here in 2013, however, I am more confident about our plans.4
Rajeev replied:
Kerry, our future rate of growth and expansion of operations now appear to lie within a smaller range of possibilities. We are anticipating growth rates of 12 percent to 26 percent per year, compared with 2 percent to 28 percent per year that we experienced prior to 2008. We have diversified significantly, leading to greater stability of revenues and greater confidence of our corporate forecasts. However, while most of our wine industry rivals in developed countries managed to recover from the Great Recession, the Indian wine industry’s subsequent growth has been relatively tepid. The premium wine-drinking segment of the developed world appears to have ‘bounced-back’ more rapidly based on worldwide growth in sales depletions of premium wines.
The only questions to be answered at this meeting are settling on the preferred growth rate and the financing alternatives to achieve that rate of growth. If we position our brands and our diversification into wine tourism correctly, do you believe that the globalization of the wine industry could present us with an opportunity to market our brand and achieve growth at rates surpassing growth of the Indian wine market?
THE INDIAN WINE INDUSTRY IN 2013
Consumption of wine was almost entirely an urban phenomenon in India. Over 90 percent of table wine consumption occurred in the cities of Delhi, Mumbai, Kolkata, Chennai and Bangalore, where each luxury international hotel was located. These “islands of affluence” constituted what was called India’s “wine archipelago.” See Exhibit 1 for a map of India. See Exhibit 2 for a map of the Maharashtra state, showing the Nashik wine-growing region where Sula was located.
According to Alok Chandra, an Indian wine expert, the industry weathered and slowly began to recover from a “triple whammy” of adverse events that occurred in or around 2008. 5 These events included:
- a slowdown in consumer spending due to the worldwide economic recession,
- a lingering impact on travel and tourism of the November 2008 Mumbai terrorist attacks as well as subsequent attacks on female tourists, and
- a weakening Indian rupee (which had depreciated from Rs 40 to Rs 50 per United States dollar in 2012).
Exhibit 1. Map of India
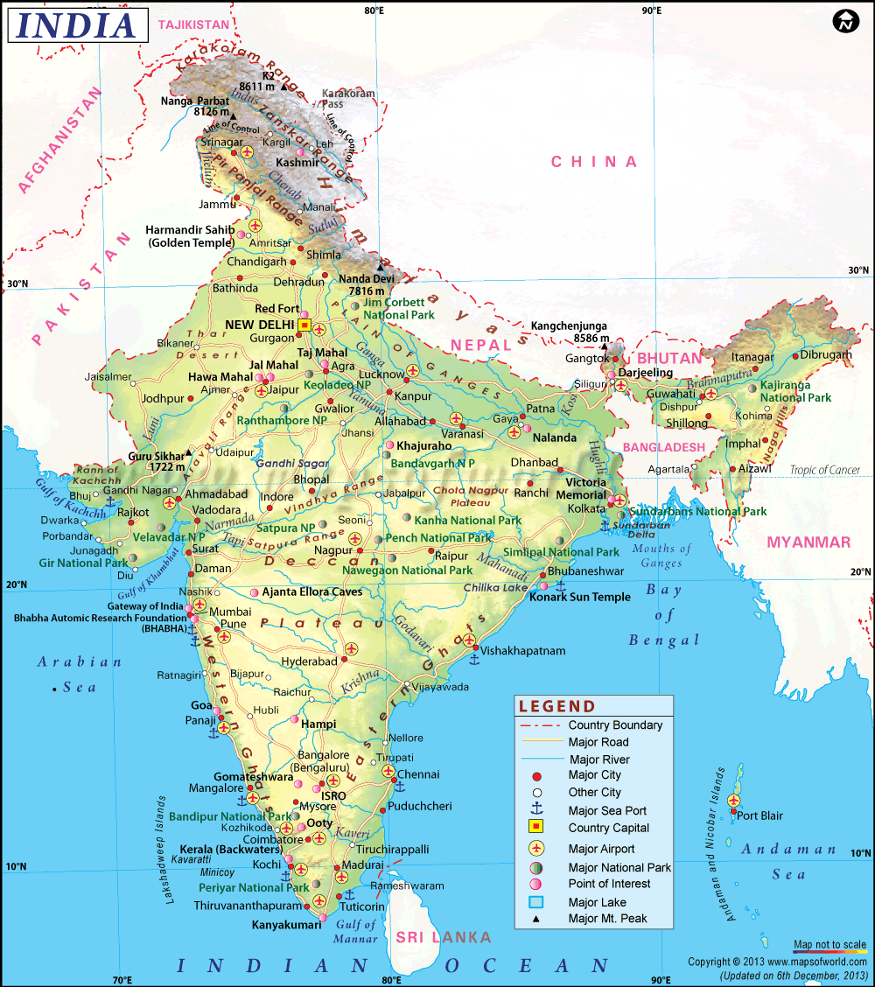
Source: MapsofIndia.com
Exhibit 2. Map of Maharashtra
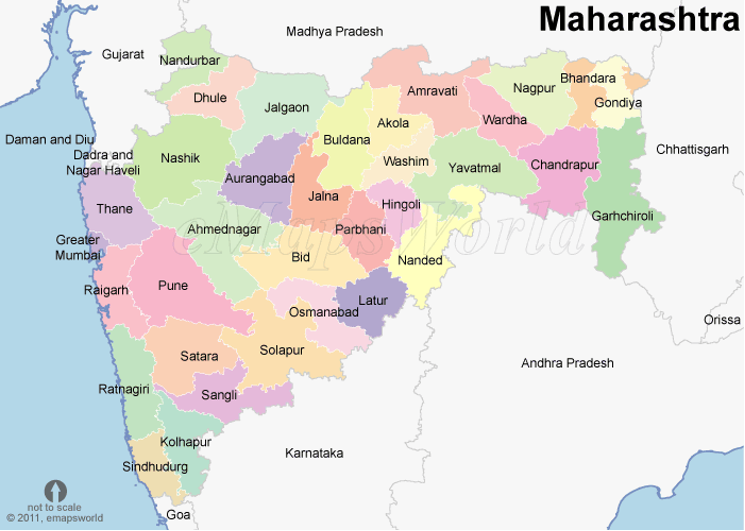
Source: MapsofIndia.com
Availability of all wines to the Indian market over the 2008–2012 period is shown in Exhibit 3.
Exhibit 3. Indian Wine Market — Domestic Availability, 2008–2012 (Thousands of 12 x 750 ml cases)
|
|
2012
|
2011
|
2010
|
2009
|
2008
|
|---|---|---|---|---|---|
|
Production
|
1,277
|
1,222
|
1,444
|
1,400
|
1,300
|
|
Imports
|
488
|
493
|
283
|
199
|
367
|
|
Annual supply
|
1,765
|
1,715
|
1,727
|
1,599
|
1,667
|
|
Exports
|
122
|
123
|
77
|
232
|
192
|
|
Domestic availability
|
1,643
|
1,592
|
1,650
|
1,367
|
1,475
|
Source: USDA Foreign Agricultural Service (2012), Wine Market Update 2012, Global Agricultural Information Network, December 14.
All alcoholic beverages were subject to the same central and state level regulations in India, at least with respect to controls, taxes and miscellaneous constraints. Some state governments selectively increased excise duties on wine products imported into their states (Maharashtra, Karnataka, Goa, and Delhi). These rising product prices contributed to reduced wine consumption. Domestic consumption of Indian wines peaked in 2008, and in the subsequent years leading up to 2012, consumption had not yet returned to those record levels, as shown in Exhibit 4.
Exhibit 4. Indian Wine Market — Consumption, 2008–2012 (Thousands of 12 x 750 ml cases)
|
|
2012
|
2011
|
2010
|
2009
|
2008
|
|---|---|---|---|---|---|
|
Still Wines
|
|
|
|
|
|
|
Red
|
575.00
|
515.00
|
440.00
|
495.00
|
645.00
|
|
White
|
320.00
|
285.00
|
235.50
|
324.50
|
440.00
|
|
Rosé
|
55.00
|
50.00
|
44.50
|
45.50
|
45.00
|
|
Total, still wines
|
950.00
|
850.00
|
720.00
|
865.00
|
1,130.00
|
|
|
|
|
|
|
|
|
Sparkling
|
93.50
|
75.50
|
61.50
|
76.00
|
122.50
|
|
Fortified
|
24.75
|
22.00
|
19.50
|
20.50
|
27.50
|
|
Light Aperitifs
|
17.50
|
14.00
|
11.00
|
12.50
|
14.00
|
|
Other
|
365.00
|
350.00
|
335.00
|
300.00
|
300.00
|
|
Total wines
|
1,450.75
|
1,311.50
|
1,147.00
|
1,274.00
|
1,594.00
|
Source: Smith, A. (2013), International Wine & Spirits Annual Report, 2013: Indian Country Report.
On the production side, as shown in Exhibit 5, expansion had been erratic and slower growing during the five-year period after 2008, only rebounding in 2012.
Exhibit 5. Indian Wine Market — Locally Produced Wines, 2008–12 (Thousands of 12 x 750 ml cases)
|
|
2012
|
2011
|
2010
|
2009
|
2008
|
|---|---|---|---|---|---|
|
Still Wine
|
730.00
|
655.00
|
580.00
|
740.00
|
175.00
|
|
Sparkling
|
52.50
|
42.00
|
35.00
|
58.00
|
22.50
|
|
Fortified
|
22.00
|
20.00
|
17.50
|
19.00
|
1.50
|
|
Light Aperitifs
|
5.00
|
5.00
|
5.00
|
6.00
|
5.50
|
|
Other
|
365.00
|
350.00
|
335.00
|
300.00
|
0.00
|
|
Total wines
|
1,174.50
|
1,072.00
|
972.50
|
1,123.00
|
204.50
|
Source: Smith, A. (2013), International Wine & Spirits Annual Report, 2013: Indian Country Report.
While the longer-term outlook for the Indian wine industry was favorable, growing from 1.2 million cases in 2008 to an estimated 5 million cases in 2013 and 50 million cases by 2028, near- term challenges were said to be significant. Overhead per bottle of wine sold in India was much higher than for spirits or beer. However, unlike the 20 percent plus growth rates of the early 2000s, industry observers estimated that production and consumption growth for Indian wines would remain in the 10 to 15 percent range, at least out to 2017–2018. 6 Imports were also affected by the “trading down” phenomenon and suffered a significant decline since 2009. See Exhibit 6 for 2008 to 2012 data on wine imported to the Indian wine market.
Exhibit 6. Indian Wine Consumption — Imports, 2008-2012 (Thousands of 12 x 750 ml cases)
|
|
2012
|
2011
|
2010
|
2009
|
2008
|
|---|---|---|---|---|---|
|
Still Wine
|
220.00
|
195.00
|
140.00
|
125.00
|
175.00
|
|
Sparkling
|
41.00
|
33.50
|
26.50
|
18.00
|
22.50
|
|
Fortified
|
2.75
|
2.00
|
2.00
|
1.50
|
1.50
|
|
Light Aperitifs
|
12.50
|
9.00
|
6.00
|
6.50
|
5.50
|
|
Total wines
|
276.25
|
239.50
|
174.50
|
151.00
|
204.50
|
Source: Smith, A. (2013), International Wine & Spirits Annual Report, 2013: Indian Country Report.
Many Indian wine producers produced lower quality still wines and had more poorly developed marketing strategies than Sula’s.7 Prior to the recession in 2008, Sula’s main rivals in India had been Chateau Indage and Grover. Chateau Indage utilized high levels of debt to facilitate a growth via acquisition strategy, leveraging its balance sheet to what proved to be a dangerous level. In 2008 and 2009, as domestic wine demand declined, so did cash flows, and Chateau Indage became insolvent, resulting in a loss of its leading market share to Sula. Grover strengthened its industry position via a merger with Zampa wines in 2012 but was still unable to reach its pre-recession competitive status.8
BUILDING A MORE SUSTAINABLE BUSINESS, 2010-12
From 2010 to 2012, Sula experienced what Rajeev later called the “Great Comeback.” He summarized the moral of the story: “If somebody wants to get on the bandwagon, the pricing had to be right. Once the person is on with the right price, he can climb the ladder.” Yet this was only a part of his strategies for that comeback. His plan was also to persuade Indian consumers to view wine as a social “glue” for a good time rather than as an intoxicant.
SulaFest contributed to expanding consumers’ product awareness, but Rajeev also pointed out on numerous occasions the health benefits of consuming red wine in moderation. These initiatives were used in negotiations with regulators in the federal and local governments concerning permits, tax rates, etc. In discussions with government officials, Rajeev lobbied that taxing wine heavily would hurt grape farmers. Also, growing grapes created rural jobs, an objective critical to local officials.
Broader economic trends, especially after 2009, contributed to Sula’s successful comeback in production, revenues and profitability. Wine became a preferred drink of growing numbers of young, urban professionals, along with a movement towards “ready to drink” beverages that did not require mixers. Another attribute of wine was that it had a lower alcohol content than hard liquor making it a more food friendly and healthier alternative.
Spearheaded by Sula’s area sales manager Sandhya Suraj, an effort was made to expand its national wine and spirits distribution network during the 2010 to 2012 period. Initially, Sula not only tapped into existing beer and spirits networks for its imported beer (Asahi) but also for its wines. As retailers began to be persuaded to stock wine alongside beer and whiskey, transportation companies were increasingly willing to take smaller additional loads of Sula wines. Rajeev also negotiated links with overseas wine and spirit makers to become an exclusive importer of their brands for India. Sula could offer access to its extensive and growing distribution network so that those brands could ship product into Indian markets in a more cost- effective way.9
“Green Sula”
Rajeev strove to make Sula Vineyards a leader in environmentally friendly winemaking in terms of water use, carbon footprint, recycling, and vermiculture (using worms to compost organic matter). He even had a name for it, “Green Sula.” Most agricultural managers agreed that water was a very precious resource. In order to conserve the water resource, Sula developed drip- irrigation operations in all its vineyards as well as at those of its contract grape growers. These systems reduced irrigation requirements by approximately 50 percent when compared to more traditional flood irrigation. These techniques also reduced soil salinity caused by over irrigation and the pooling of salt laden water. At Sula’s Dindori Vineyard, a water harvesting system was developed that recycled run-off irrigation water directly back to the vineyards. When hillside vineyards were irrigated, excess water hit hard rock underground and was channeled to a reservoir. It was then pumped back into the drip system, reducing water use by 20 percent.
Sula operated state-of-the-art wastewater treatment plants. All wastewater from cleaning and other winery operations was treated and recycled for landscape irrigation. Sula recycled many of the bottles it used. Water from bottling line saturation looped back to a storage tank for re-use. Gray water from restrooms was also treated and re-used. During the annual monsoon season, a rainwater harvesting system kicked into gear, further conserving precious groundwater. Stored rainwater had an added benefit; it did not require softening or filtration, further cutting power costs and reducing waste. Sula’s water saving strategies were shared with contract growers and other wineries in the Nashik region through educational seminars, with future plans to educate and expand water saving practices across India.
In order to reduce Sula’s carbon footprint, power usage per bottle sold was reduced by 30 percent from 2010 to 2012. Fermentation and storage tanks were insulated. All incandescent bulbs were replaced by energy-efficient CFLs. Solar panels were installed for all hot water needs while a heat-exchange system brought warm outlet water from the chilling system to the boiler feed, further reducing power consumption. Sula production engineers analyzed Sula’s energy usage patterns and designed a system that reduced consumption during expensive peak hours and took maximum advantage of rebated off-peak hours. By early 2013, Sula already controlled 1,500 planted vineyard acres, with most operations performed by hand. These strategies minimized tractor use, thus reducing carbon emissions, but also avoided soil compaction by heavy machinery. Compaction degraded soil quality, so these methods contributed to the sustainability of vineyard production.
Another “green” initiative involved recycling glass bottles. The firm arranged to have empty Sula bottles picked up by one of its four recycling centers in Bangalore, Bombay, Delhi, and Goa. They were then sent back to the winery for thorough cleaning and sterilization before beginning a second life as a bottle for Sula’s second label, Samara wine. That’s how Sula kept the sand dunes of Goa glass-free! Another initiative involved “worms and other friendly creatures.” After the grapes were crushed each year, the remaining pomace, composed of stems, seeds and skins, was mixed with manure and turned into rich compost by thousands of wriggly worms in the vermin-compost pits. Vermiculture composting was key to reducing the use of chemical fertilizers, by producing compost so rich that the vineyards would not need any other nutrition. By cutting out chemical usage, the vineyards were transformed into havens for a multitude of birdlife and frogs, indicators of a thriving eco-system.
Diversification
One major thrust for Sula over the 2010 to 2012 period was to grow winemaking capacity. A second thrust was to fund Sula’s diversification into the Hospitality marketplace, in order to add stability to revenues. Rajeev recalled:
Our Little Italy restaurant, opened back in 2009, has been doing quite well recently, especially with upgrades to the Nashik highway, especially from Mumbai. Little Italy is India’s first vineyard restaurant, a partnership between Sula and Little Italy, India’s most popular Italian restaurant chain. Food and beverages are served Mediterranean style in this 50-seat facility. Our 2,000 square foot tasting room has also been a tremendous success in introducing visitors to our wine portfolio and generating growing revenues from direct sales. Designed by a California architect and located atop the Nashik winery, it provides spectacular 180-degree views of the vineyards and surrounding lakes and hills.
Our open-air Greek-style amphitheater, where SulaFest is held, is set in the middle of Sula’s estate vineyards. It is also suitable for weddings, parties, art exhibitions, commercial events and shows, theatrical performances, banquet catering, etc. The amphitheater is located next to the Little Italy and Soma (Indian) restaurants. Also nearby is Vinoteca @ Sula, a wine bar inspired by Spain’s quaint neighborhood wine bars that serve wine cocktails, tapas (small plates), and pintxos (Basque-style skewered appetizers) prepared by a Spanish chef. With 1,600 square feet and a 50- seat capacity, Vinotecha provides visitors with an authentic, healthy, affordable, and very social atmosphere to enjoy traditional Spanish dishes matched with Sula wines.
Also important to our hospitality strategy has been our three-bed bungalow, Beyond, designed for guests who would like to stay in the area for a few days. With capacity utilization reaching over 90 percent in the last year, perhaps an expansion of this extended stay strategy should be explored in more detail. While not a high priority under current austerity conditions, in a year or two, this plan should be revisited and explored in more detail. I have estimated that more than 100,000 visitors can be expected this year in the Nashik region.
These initiatives were financed by internally generated cash flow, company borrowings, and sales of equity to both Indivision India Partners in 2010 and to Verlinvest S.A., a Belgian family owned investment holding company (USD 15 million) in 2011. Funds raised from these sales of equity were allocated to double the capacity of Sula’s winemaking operations.
Specifically, funds were used to (1) plant an additional 1,000 acres of grapes out to 2015, in order to bring the total number of acres under vine to 2,200; (2) finance the construction of Sula’s new 2 million liter winery at Pimpane, near Nashik; and (3) increase staff counts to nearly 300 in order to run the new winery. After this infusion of capital, the Samant family’s ownership position was reduced to 50 percent.
By 2011 and 2012, Sula’s revenues had grown significantly faster than those of the Indian wine market, resulting in annual increases in Sula’s market share. Product pricing had stabilized and “premiumization” — consumers trading –up in prices paid for table wines — allowed Sula to increase prices slowly on its higher priced brands, while sales volumes continued to rise.
Sula’s 2008 to 2012 income statements and balance sheets are shown in Exhibits 7 and 8. Sula’s 2009 to 2012 statements of cash flow are shown in Exhibit 9.
Exhibit 7. Sula Vineyards —Income Statements, 2008–2012 ($000 omitted)
|
FY March 31
|
2012
|
2011
|
2010
|
2009
|
2008
|
|---|---|---|---|---|---|
|
Revenues
|
$24,473
|
$19,378
|
$14,313
|
$11,054
|
$9,714
|
|
Less: Cost of Goods Sold
|
|
|
|
|
|
|
Purchases
|
6,114
|
4,916
|
4,034
|
3,121
|
3,020
|
|
Mfg. & Operating
|
4,264
|
3,019
|
2,226
|
1,708
|
1,528
|
|
Direct Labor
|
3,207
|
2,850
|
1,892
|
1,409
|
1,143
|
|
|
|
|
|
|
|
|
Total COGS
|
13,585
|
10,785
|
8,152
|
6,238
|
5,691
|
|
|
|
|
|
|
|
|
Gross Margin
|
10,888
|
8,593
|
6,161
|
4,816
|
4,023
|
|
|
|
|
|
|
|
|
Advertising Expenses
|
1,912
|
1,498
|
1,224
|
1,364
|
1,022
|
|
Selling & Marketing
|
2,729
|
2,206
|
1,589
|
1,412
|
1,151
|
|
Sales Tax
|
1,403
|
1,062
|
877
|
783
|
721
|
|
Total Expenses
|
6,044
|
4,766
|
3,690
|
3,559
|
2,894
|
|
|
|
|
|
|
|
|
EBITDA
|
4,844
|
3,827
|
2,471
|
1,257
|
1,129
|
|
|
|
|
|
|
|
|
Depreciation
|
929
|
712
|
404
|
298
|
289
|
|
|
|
|
|
|
|
|
EBIT
|
3,915
|
3,115
|
2,067
|
959
|
840
|
|
|
|
|
|
|
|
|
Interest
|
1,721
|
1,367
|
1,123
|
606
|
324
|
|
|
|
|
|
|
|
|
Profit Before Tax
|
2,194
|
1,748
|
944
|
353
|
516
|
|
|
|
|
|
|
|
|
Tax (10%)
|
219
|
175
|
94
|
35
|
52
|
|
|
|
|
|
|
|
|
Net Income
|
1,975
|
1,573
|
850
|
318
|
464
|
Source: company reports.
Exhibit 8. Sula Vineyards — Balance Sheets, 2008–2012 ($000 omitted)
|
FYE March 31
|
2012
|
2011
|
2010
|
2009
|
2008
|
|---|---|---|---|---|---|
|
ASSETS
|
|
|
|
|
|
|
Current Assets
|
|
|
|
|
|
|
Cash
|
$512
|
$427
|
$353
|
$252
|
$246
|
|
Accounts Receivable
|
5,276
|
4,166
|
3,710
|
2,646
|
2,433
|
|
Inventories
|
17,145
|
12,981
|
9,802
|
8,075
|
7,812
|
|
Loans & Advances
|
882
|
766
|
781
|
644
|
856
|
|
|
|
|
|
|
|
|
Total Current Assets
|
$23,815
|
$18,340
|
$14,646
|
$11,617
|
$11,347
|
|
Fixed Assets
|
|
|
|
|
|
|
Property, Plant & Equipment
|
12,816
|
10,647
|
8,673
|
6,304
|
5,476
|
|
Less: Accum. Deprec. & Amort.
|
2,787
|
1,858
|
1,146
|
742
|
444
|
|
|
|
|
|
|
|
|
Property, Plant & Equipment, net
|
$10,029
|
$8,789
|
$7,527
|
$5,562
|
$5,032
|
|
|
|
|
|
|
|
|
Other Assets
|
136
|
107
|
96
|
83
|
81
|
|
|
|
|
|
|
|
|
Total Assets
|
$33,980
|
$27,236
|
$22,269
|
$17,262
|
$16,460
|
|
|
|
|
|
|
|
|
LIABILITIES AND CAPITAL
|
|
|
|
|
|
|
Current Liabilities
|
|
|
|
|
|
|
Accounts Payable
|
$1,076
|
$812
|
$606
|
$510
|
$447
|
|
Other Liabilities
|
426
|
322
|
215
|
166
|
112
|
|
Notes Payable (Bank)
|
9,499
|
8,525
|
6,889
|
6,860
|
6,675
|
|
Accrued Expenses
|
1,114
|
887
|
642
|
549
|
471
|
|
|
|
|
|
|
|
|
Total Current Liabilities
|
$12,115
|
$10,546
|
$8,352
|
$8,085
|
$7,705
|
|
|
|
|
|
|
|
|
Secured Loans (Net)
|
8,800
|
7,600
|
6,400
|
4,700
|
4,600
|
|
Deferred Tax Liability (Net)
|
|
|
|
10
|
6
|
|
|
|
|
|
|
|
|
Total Long Term Commitments
|
8,800
|
7,600
|
6,400
|
4,710
|
4.606
|
|
|
|
|
|
|
|
|
Equity
|
|
|
|
|
|
|
Share Capital
|
600
|
500
|
500
|
300
|
300
|
|
Capital Surplus
|
7,700
|
5,800
|
5,800
|
3,800
|
3,800
|
|
Retained Earnings
|
4,765
|
2,790
|
1,217
|
367
|
49
|
|
|
|
|
|
|
|
|
Total Equity
|
$13,065
|
$9,090
|
$7,517
|
$4,467
|
$4,149
|
|
|
|
|
|
|
|
|
Total Liabilities and Equity
|
$33,980
|
$27,236
|
$22,269
|
$17,262
|
$16,460
|
Source: company reports.
Exhibit 9. Sula Vineyards — Statements of Cash Flow, 2009–2012 ($000)
|
|
2012
|
2011
|
2010
|
2009
|
|---|---|---|---|---|
|
CASH FLOWS FROM OPERATING ACTIVITIES
|
|
|
|
|
|
Net Income
|
$1,975
|
$1,573
|
$850
|
$318
|
|
Depreciation
|
929
|
712
|
404
|
298
|
|
Increase in Receivable (Net)
|
1,110
|
456
|
1,064
|
213
|
|
Increase in Inventories
|
4,164
|
3,179
|
1,727
|
263
|
|
Increase in Loans and Advances
|
116
|
(15)
|
137
|
(212)
|
|
Increase in Accounts Payable
|
264
|
206
|
96
|
63
|
|
Increase in other Liabilities
|
104
|
107
|
49
|
54
|
|
Increase in Bank Notes Payable
|
974
|
1,636
|
29
|
185
|
|
Increase in Accrued Expenses
|
227
|
245
|
93
|
78
|
|
|
|
|
|
|
|
Net Cash Provided (used) by Operating Activities
|
(917)
|
859
|
(1,407)
|
732
|
|
|
|
|
|
|
|
CASH FLOWS FROM INVESTING ACTIVITIES
|
|
|
|
|
|
Purchase of Property, Plant and Equipment
|
2,169
|
1,974
|
2,369
|
828
|
|
Other Assets
|
29
|
11
|
13
|
2
|
|
|
|
|
|
|
|
Net Cash used for Investing Activities
|
(2,198)
|
(1,985)
|
(2,382)
|
(830)
|
|
|
|
|
|
|
|
CASH FLOWS FROM FINANCING ACTIVITIES
|
|
|
|
|
|
Increase (Decrease) from Secured Loans
|
1,200
|
1,200
|
1,700
|
100
|
|
Increase (Decrease) from Deferred Tax Liabilities
|
|
|
(10)
|
4
|
|
Increase (Decrease) in Share Capital
|
100
|
|
200
|
|
|
Increase (Decrease) from Capital Surplus
|
1,900
|
|
2,000
|
|
|
|
|
|
|
|
|
Net Cash Provided (used) for Financing Activities
|
3,200
|
1,200
|
3,890
|
104
|
|
|
|
|
|
|
|
Net Change in Cash
|
84
|
74
|
100
|
6
|
|
Cash at the Beginning of the year
|
427
|
353
|
252
|
246
|
|
Cash at the End of the year
|
$512
|
$427
|
$353
|
$25
|
Note: numbers may not agree due to rounding.
Source: company reports.
FUTURE SCENARIOS
At the April 2013 meeting, the two co-founders, Rajeev and Kerry, were joined by Sula’s general manager of winery operations, Rohan Shahi, as well as by area sales manager, Sandhya Suraj. Rajeev reportedly began the meeting by sounding a familiar optimistic note, “We are moving in the right direction, to generate benefits for all of our stakeholders.”10 Rajeev then shared more granular revenue data by varietal wine and by activity with his team, as shown in Exhibits 10-14.
Exhibit 10. Sula Vineyards — Annual Sales by Varietal Wine, in cases, 2008–2012
|
|
2012
|
2011
|
2010
|
2009
|
2008
|
|---|---|---|---|---|---|
|
Wine Categories
|
|
|
|
|
|
|
Whites
|
|
|
|
|
|
|
Sula Sauvignon Blanc
|
29,800
|
26,600
|
24,700
|
25,300
|
24,200
|
|
Sula Chenin Blanc
|
38,300
|
36,000
|
28,000
|
24,200
|
21,800
|
|
Dindori Reserve Vi ogni er
|
2,500
|
2,200
|
2,000
|
1,600
|
1,200
|
|
Samara White
|
25,700
|
22,400
|
18,000
|
13,000
|
11,400
|
|
Madera White
|
21,100
|
14,300
|
8,900
|
6,200
|
-
|
|
Dia White
|
20,800
|
15,100
|
9,200
|
4,800
|
-
|
|
Total Whites
|
138,200
|
116,600
|
90,800
|
75,100
|
58,600
|
|
|
|
|
|
|
|
|
Reds
|
|
|
|
|
|
|
Sula Cabernet Shiraz
|
68,600
|
53,400
|
39,600
|
28,500
|
27,600
|
|
Sula Zinfandel
|
7,750
|
4,900
|
4,500
|
5,000
|
6,000
|
|
Dindori Reserve Shiraz
|
9,800
|
6,300
|
3,500
|
1,500
|
1,000
|
|
Merlot
|
23,600
|
18,200
|
14,700
|
12,600
|
11,400
|
|
Sula Grenache Shiraz
|
7,700
|
6,100
|
3,000
|
1,200
|
1,000
|
|
Samara Red
|
27,300
|
21,400
|
14,100
|
7,200
|
4,800
|
|
Madera Red
|
36,400
|
31,400
|
24,200
|
17,600
|
15,700
|
|
Sula 1000
|
96,600
|
70,900
|
35,300
|
30,500
|
45,500
|
|
Total Reds
|
277,750
|
212,600
|
138,900
|
104,100
|
113,000
|
|
|
|
|
|
|
|
|
Rosé
|
|
|
|
|
|
|
Sula Zinfandel
|
8,700
|
6,200
|
3,700
|
2,000
|
2,000
|
|
Madera Rose
|
3,900
|
3,100
|
2,100
|
1,000
|
-
|
|
Total Rosé
|
12,600
|
9,300
|
5,800
|
3,000
|
2,000
|
|
Dessert
|
|
|
|
|
|
|
Late Harvest Chenin Blanc
|
2,700
|
2,600
|
2,300
|
2,000
|
3,000
|
|
Sparkling
|
|
|
|
|
|
|
Sula Brut
|
24,500
|
20,700
|
17,500
|
12,000
|
11,000
|
|
Sula Seco
|
10,200
|
8,200
|
4,700
|
2,600
|
-
|
|
Total Sparkling
|
34,700
|
28,900
|
22,200
|
14,600
|
11,000
|
|
Total Cases
|
465,950
|
370,000
|
260,000
|
198,800
|
187,600
|
|
Winery Capacities
|
|
|
|
|
|
|
Cases
|
500,000
|
416,666
|
316,666
|
216,666
|
216,666
|
|
Liters
|
4,500,000
|
3,750,000
|
2,850,000
|
1,950,000
|
1,950,000
|
|
Bottles
|
6,000,000
|
5,000,000
|
3,800,000
|
2,600,000
|
2,600,000
|
Source: Company reports.
Rohan had a suggestion to make from an operational perspective: “A hiring freeze on personnel seems reasonable, at least for now. Vineyard expansion could be put on hold. All elements of ‘cost’ might also be examined critically.”
Sandhya also weighed in from the sales and distribution side:
Over the years, we have developed an extensive and sophisticated distribution system for our own products. Since we are using this system to sell a growing variety of imported wine from Chile, Australia, Italy, and the United States, could it also be used for other “beverages” that might sell well in India?
Exhibit 11. Sula Vineyards — Annual Revenues by Varietal Wine, per case, 2008–2012
|
Wine Categories
|
2012
|
2011
|
2010
|
2009
|
2008
|
|---|---|---|---|---|---|
|
White wines
|
|
|
|
|
|
|
Sula Sauvignon Blanc
|
$59.20
|
$58.90
|
$58.70
|
$56.60
|
$57.60
|
|
Sula Chenin Blanc
|
56.40
|
56.20
|
55.60
|
54.20
|
54.60
|
|
Dindori Reserve Viognier
|
67.80
|
67.60
|
67.10
|
66.70
|
66.60
|
|
Samara White
|
27.70
|
27.40
|
27.20
|
26.80
|
26.40
|
|
Madera White
|
34.60
|
34.40
|
34.30
|
33.50
|
0.00
|
|
Dia White
|
32.70
|
32.70
|
32.20
|
30.70
|
0.00
|
|
Average Whites
|
51.55
|
52.31
|
51.30
|
52.04
|
55.50
|
|
Red wines
|
|
|
|
|
|
|
Sula Cabernet Shiraz
|
67.70
|
64.80
|
63.70
|
62.30
|
62.20
|
|
Sula Zinfandel
|
59.40
|
58.20
|
57.90
|
56.60
|
57.70
|
|
Dindori Reserve Shiraz
|
84.80
|
83.20
|
80.90
|
78.60
|
78.20
|
|
Merlot
|
65.30
|
63.10
|
62.30
|
61.40
|
61.30
|
|
Sula Grenache Shiraz
|
38.60
|
38.40
|
37.90
|
35.50
|
35.10
|
|
Samara Red
|
28.10
|
27.80
|
27.60
|
27.10
|
26.80
|
|
Madera Red
|
34.70
|
34.50
|
34.40
|
33.70
|
19.40
|
|
Sula 1000
|
19.90
|
19.60
|
19.50
|
19.40
|
19.40
|
|
Average Reds
|
61.30
|
66.96
|
60.06
|
60.11
|
60.62
|
|
Rosé wines
|
|
|
|
|
|
|
Sula Zinfandel
|
59.80
|
59.20
|
58.70
|
58.30
|
58.10
|
|
Madera Rosé
|
34.50
|
34.30
|
34.20
|
33.40
|
0.00
|
|
Average Rosé
|
47.15
|
46.75
|
46.45
|
45.85
|
29.05
|
|
Dessert
|
|
|
|
|
|
|
Late Harvest Chenin Blanc
|
47.20
|
46.60
|
46.30
|
44.60
|
45.30
|
|
Sparkling
|
|
|
|
|
|
|
Sula Brut
|
69.80
|
68.70
|
67.90
|
65.70
|
65.60
|
|
Sula Seco
|
61.20
|
60.90
|
60.60
|
60.20
|
|
|
Average sparkling
|
65.50
|
64.80
|
64.25
|
62.95
|
65.60
|
Source: Company reports.
Sandhya also reminded the team about Sula’s 2007 decision to import Asahi beer from Japan. This was the 9th largest beer brand in the world and another premium beverage for the Indian marketplace. More recently, Mateus, a Portuguese wine, had been added to Sula’s product portfolio. A variety of single malt whiskeys and vodkas were also under consideration for addition to Sula’s roster of alcoholic beverage imports. Over 60 percent of company revenues were now being generated by wine sales to pubs, bars, caterers, restaurants and five-star hotels.
Kerry had brought along a handout of his own to share, which included some specific guidelines for the management team to evaluate (see Appendix A and supporting tables). Each guideline included the projected portfolio mix of wine brands and other activities, as well as his pricing and forecasting assumptions. From these revenue streams, guidelines for expected growth in expenses would aid the development of pro forma income statements. Kerry provided estimates for Sula’s future assets and liabilities accounts to help the team construct pro forma balance sheets. Once these projections were agreed upon, the team would be able to estimate Sula’s ability to generate future internal cash flows. The final step in the process would be to estimate the amount and composition of external financing that would be needed to support asset expansion. These plans and projections would later need to be presented to Sula’s board of directors, in order for them to determine the most advantageous path for Sula’s future growth, how to finance that growth, and Sula’s eventual position in the future development of the Indian wine industry.
Exhibit 12. Sula Vineyards — Revenues by Product Category, 2008–2012
|
Wine Categories
|
2012
|
2011
|
2010
|
2009
|
2008
|
|---|---|---|---|---|---|
|
White wines
|
|
|
|
|
|
|
Sula Sauvignon
Blanc
|
$1,764,160
|
$1,566,740
|
$1,449,890
|
$1,431,980
|
$1,393,920
|
|
Sula Chenin Blanc
|
2,160,120
|
2,023,200
|
1,556,800
|
1,311,640
|
1,190,280
|
|
Dindori Reserve
Viognier
|
169,500
|
148,720
|
134,200
|
106,720
|
79,920
|
|
Samara White
|
711,890
|
613,760
|
489,600
|
348,400
|
300,960
|
|
Madera White
|
730,060
|
491,920
|
305,270
|
207,700
|
|
|
Dia White
|
680,160
|
493,770
|
296,240
|
147,360
|
|
|
Total Whites
|
6,215,890
|
5,338,110
|
4,232,000
|
3,553,800
|
2,965,080
|
|
Red wines
|
|
|
|
|
|
|
Sula Cabernet Shiraz
|
4,644,220
|
3,460,320
|
2,522,520
|
1,775,550
|
1,716,720
|
|
Sula Zinfandel
|
460,350
|
285,180
|
260,550
|
283,000
|
346,200
|
|
Dindori Reserve
Shiraz
|
831,040
|
524,160
|
283,150
|
117,900
|
78,200
|
|
Merlot
|
1,541,080
|
1,148,420
|
915,810
|
773,640
|
698,820
|
|
Sula Grenache
Shiraz
|
297,220
|
234,240
|
113,700
|
42,600
|
35,100
|
|
Samara Red
|
767,130
|
594,920
|
389,160
|
195,120
|
128,640
|
|
Madera Red
|
1,263,080
|
1,083,300
|
832,480
|
593,120
|
304,580
|
|
Sula 1000
|
1,922,340
|
1,389,640
|
688,350
|
591,700
|
882,700
|
|
Total Reds
|
11,726,460
|
8,720,180
|
6,005,720
|
4,372,630
|
4,190,960
|
|
Rosé wines
|
|
|
|
|
|
|
Sula Zinfandel
|
520,260
|
367,040
|
217,190
|
116,600
|
116,200
|
|
Madera Rosé
|
134,550
|
106,330
|
71,820
|
33,400
|
|
|
Total Rosé
|
654,810
|
473,370
|
289,010
|
150,000
|
116,200
|
|
Dessert
|
|
|
|
|
|
|
Late Harvest Chenin
Blanc
|
127,440
|
121,160
|
106,490
|
89,200
|
135,900
|
|
Sparkling
|
|
|
|
|
|
|
Sula Brut
|
1,710,100
|
1,422,090
|
1,188,250
|
788,400
|
721,600
|
|
Sula Seco
|
624,240
|
499,380
|
284,820
|
156,520
|
|
|
Total sparkling
|
2,334,340
|
1,921,470
|
1,473,070
|
944,920
|
721,600
|
|
Total revenues,
wine
|
$21,058,940
|
$21,058,940
|
$12,106,290
|
$12,106,290
|
$8,129,740
|
Source: Company reports.
Exhibit 13. Sula Vineyards — Volume / Price Relationships, 2008–2012
|
|
2012
|
2011
|
2010
|
2009
|
2008
|
|---|---|---|---|---|---|
|
Volume (cases)
|
17,760
|
13,320
|
10,140
|
8,976
|
7,712
|
|
Average Price
|
$57.04
|
$56.24
|
$55.38
|
$58.25
|
$56.53
|
|
Revenue
|
$1,013,030
|
$749,117
|
$561,553
|
$522,852
|
$435,959
|
Source: Company reports.
Exhibit 14. Sula Vineyards — Revenues by Activity, 2008–2012
|
|
2012
|
2011
|
2010
|
2009
|
2008
|
|---|---|---|---|---|---|
|
Wine sales (domestic
production)
|
$21,058,940
|
$16,574,290
|
$12,106,290
|
$9,110,550
|
$8,129,740
|
|
Wine sales (imports)
|
1,013,030
|
714,117
|
561,553
|
522,852
|
435,956
|
|
Beer sales (imports)
|
1,178,490
|
963,814
|
726,530
|
686,200
|
548,000
|
|
Hospitality revenues
(food & lodging)
|
1,222,099
|
1,125,516
|
918,937
|
734,330
|
599,954
|
|
Total revenues
|
$24,472,559
|
$19,377,737
|
$14,313,310
|
$11,053,932
|
$9,713,650
|
Source: Company reports.
Wrapping up the team meeting, Rajeev reminded the others that he expected to continue to be extremely active in promoting Sula Vineyards and the Indian wine industry, now almost one and one-half decades old. Stanford Magazine had once dubbed him the “Mondavi of Mumbai,” and more recently, he had begun calling himself a “wine evangelist” for the Indian industry. 11 Showing no signs of slowing down in his support for sustainable growth in both Sula’s and India’s wine demand, in the back of his mind, he wondered how rapidly Sula revenues, from both wine products and wine tourism, would grow over the next few years, and what level of financings would be needed to support that growth.
ENDNOTES
1 For more information about Sula Vineyards’ early challenges and its evolution to 2008, see Lopez, R. H., Gilinsky, A., & Shah, J. (2008), “Sula Vineyards”, Case Research Journal, 28(3/4), Summer/Fall, 17-40.
2 Maharashtra and Nashik tourism information can be obtained from: https://www.maharashtratourism.gov.in/destination/nashik, retrieved March 15, 2016.
3 For more information about Sula Vineyards’ diversification activities since 2008, see Narasimhan, A. and Dogra, A. M. (2011), “Developing India’s Taste For Wine,” The Financial Times, December 5.
4 All quotations from company principals are based on e-mail correspondence with case author and facts were later verified by Shardul Ghogale, Senior Manager, International Business, Sula Vineyards.
5 Chandra, A. (2016), “The Business of Wine,” Business Standard, March 5, retrieved from http://www.business- standard.com/article/beyond-business/the-business-of-wine-116030401522_1.html , accessed March 6, 2016.
6 Mahathi, A. R. (2012), “How Sula Got It Right,” August 1, retrieved from: http://www.thesmartceothe.in/index.php?option=com_content&view=search, accessed June 1, 2015.
7 Chandra, A. (2014), “Investment Required in Wine,” Business Standard, July 26, retrieved from: http://www.business-standard.com/article/beyond-business/investment-required-in-wine-114072501471_1.html, accessed June 1, 2015.
8 Chandra, A. (2014), “The Rise and Return of Grover Vineyards,” Business Standard, November 1, retrieved from: http://www.business-standard.com/article/beyond-business/the-rise-and-return-of-grover-vineyards- 114103101609_1.html, accessed June 1, 2015.
9 Narasimhan and Dogra (2011), op. cit.
10 Ibid.
11 Rigoglioso, M., (2004), “The Mondavi of Mumbai,” Stanford Magazine, January/February.
Appendix A
Kerry Damskey’s Pricing and Production Forecasts
My Expectations for Sula Vineyards’ Financial Performance over the Next Five Years: Three Alternative Plans
Pursuant to our recent conversation concerning the future operations and financial performance of Sula Vineyards, the data in Table A-1 below have been prepared to analyze prospects for the marketing of our current product portfolio. While new wines may be designed, produced and sold in future years, they have not been included in this report, because of uncertainty as to timing and brand type. Prospects for the pricing of our Indian wine portfolio appear bright. Demand is growing very rapidly, but our market penetration remains quite small. Therefore, steadily rising price realizations at moderate rates would appear to be quite reasonable. In recent years, prices have been firm, and there is every reason to expect this strength to continue. Any price increases above these rates would not adversely affect quantity demanded, and, therefore, could only enhance projected cash flows. With respect to production growth, three alternative sets of rates in Table A-1 are provided for discussion. The choice of which one to follow will be based on market demand as well as resource utilization of our asset portfolio and the ability to continue to expand production in an efficient and effective manner. Financing sources will also play key roles in our final decision.
Table A–1. Sula Vineyards — Product Category Pricing and Production Assumptions, 2013-2017
|
Growth rate in production
|
||||
|---|---|---|---|---|
|
Wine Categories
|
Growth rate in unit
prices
|
Scenario
A
|
Scenario
B
|
Scenario
C
|
|
White wines
|
|
|
|
|
|
Sula Sauvignon Blanc
|
2.5%
|
6.0%
|
14.0%
|
23.0%
|
|
Sula Chenin Blanc
|
3.0%
|
6.0%
|
14.0%
|
23.0%
|
|
Dindori Reserve Viognier
|
3.0%
|
10.0%
|
15.0%
|
20.0%
|
|
Samara White
|
2.1%
|
12.0%
|
18.0%
|
24.0%
|
|
Madera White
|
2.5%
|
12.0%
|
18.0%
|
24.0%
|
|
Dia White
|
3.0%
|
10.0%
|
15.0%
|
20.0%
|
|
Red wines
|
|
|
|
|
|
Sula Cabernet Shiraz
|
2.5%
|
15.0%
|
20.0%
|
25.0%
|
|
Sula Zinfandel
|
2.0%
|
15.0%
|
20.0%
|
25.0%
|
|
Dindori Reserve Shiraz
|
3.0%
|
10.0%
|
15.0%
|
20.0%
|
|
Merlot
|
2.5%
|
15.0%
|
20.0%
|
25.0%
|
|
Sula Grenache Shiraz
|
2.5%
|
20.0%
|
25.0%
|
30.0%
|
|
Samara Red
|
2.5%
|
20.0%
|
25.0%
|
30.0%
|
|
Madera Red
|
2.5%
|
12.0%
|
18.0%
|
24.0%
|
|
Sula 1000
|
3.5%
|
20.0%
|
28.0%
|
36.0%
|
|
Rosé wines
|
|
|
|
|
|
Sula Zinfandel
|
3.0%
|
10.0%
|
15.0%
|
20.0%
|
|
Madera Rosé
|
2.5%
|
12.0%
|
18.0%
|
24.0%
|
|
Dessert
|
|
|
|
|
|
Late Harvest Chenin Blanc
|
4.0%
|
15.0%
|
20.0%
|
25.0%
|
|
Sparkling wines
|
|
|
|
|
|
Sula Brut
|
3.0%
|
10.0%
|
15.0%
|
20.0%
|
|
Sula Seco
|
3.5%
|
15.0%
|
20.0%
|
25.0%
|
Source: Company reports.
After we examine the market for Indian wines and project possible revenue growth streams, based on acceptance and extrapolation from Table A-1 data, we can generate alternative financial forecasts of income statements and balance sheets for Sula Vineyards. A number of assumptions have been incorporated into Tables A-2, A-3, A-4, and A-5, such as the changing product mix towards more red wines and economics of scale and scope as the firm grows. Note: The impact of each growth plan can only be finalized after pro forma statements have been generated and analyzed.
Table A–2. Sula Vineyards — Assumptions For Pro Forma Income Statements (Items as a percentage of revenues).
|
Scenario
|
A
|
B
|
C
|
|---|---|---|---|
|
Revenues for each business segment:
|
|
|
|
|
Domestic wines
|
|
|
|
|
Imported wines
|
|
|
|
|
Beer sales (imports)
|
|
|
|
|
Hospitality
|
|
|
|
|
Cost of Goods Sold
|
|
|
|
|
Purchases
|
25.0%
|
24.5%
|
24.0%
|
|
Manufacturing and Operating Expenses
|
18.0%
|
17.0%
|
16.0%
|
|
Direct labor
|
13.0%
|
12.7%
|
12.5%
|
|
Advertising
|
8.0%
|
7.8%
|
7.7%
|
|
Sales and marketing
|
11.3%
|
11.0%
|
10.8%
|
|
Sales taxes
|
6.0%
|
6.0%
|
6.0%
|
|
Interest and financing costs
|
(7% of average borrowings)
|
||
|
Depreciation
|
(See balance sheet)
|
||
|
Provision for taxes
|
(10% of net income)
|
||
Source: Company reports.
Table A–3. Sula Vineyards — Assumptions For Pro Forma Balance Sheets (Items as a percentage of revenues)
|
Scenario
|
A
|
B
|
C
|
|---|---|---|---|
|
Cash
|
2.1%
|
2.0%
|
1.9%
|
|
Accounts Receivable
|
22.0%
|
23.0%
|
24.0%
|
|
Inventories
|
71.0%
|
73.0%
|
75.0%
|
|
Loans and Advances
|
4.0%
|
4.0%
|
3.9%
|
|
Fixed Assets
|
|
|
|
|
Property, Plant and Equipment
|
55.0%
|
56.0%
|
57.0%
|
|
Accumulated Depreciation
|
12.0%
|
11.5%
|
11.0%
|
|
Net Property, Plant and Equipment
|
43.0%
|
44.5%
|
46.0%
|
|
Other Assets
|
0.6%
|
0.6%
|
0.6%
|
|
|
|
|
|
|
Accounts Payable
|
4.5%
|
4.6%
|
4.8%
|
|
1.8%
|
1.9%
|
1.9%
|
|
|
Accrued Expenses
|
4.6%
|
4.8%
|
5.0%
|
|
|
|
|
|
|
[“Plug figure”]
|
|||
|
Secured Debt (percentage of net PP&E)
|
79.0%
|
81.0%
|
83.0%
|
Source: Company reports.
Table A–4. Sula Vineyards — Import Sales and Net Revenue Forecasts, 2013–2017
|
|
2013
|
2014
|
2015
|
2016
|
2017
|
|---|---|---|---|---|---|
|
Cases of wine sold
|
21,200
|
24,380
|
26,860
|
29,700
|
32,430
|
|
Revenue per Case
|
$57.54
|
$58.14
|
$58.78
|
$59.32
|
$59.85
|
|
Import Revenue
|
$1,219,848
|
$1,417,453
|
$1,578,830
|
$1,761,804
|
$1,940,936
|
|
Beer Revenue
|
$1,414,188
|
$1,640,458
|
$1,902,864
|
$2,188,200
|
$2,494,600
|
Source: Company reports.
Table A–5. Sula Vineyards — Assumptions For Hospitality Revenues, 2013–2017
|
Available Rooms
|
45
|
|---|---|
|
Capacity Utilization
(Occupancy rate, percent)
|
60 percent in 2013
Rising by 5 percentage points per year to reach 80 percent in 2017
|
|
Room Prices
(Revenue per average room or RevPar)
|
$145 in FY 2013
Increasing by $3, $4, $5 and $6 per year to $163 in 2017
|
|
Food & Beverage Revenues
|
$340,000 in FY 2012
Growing by 15 percent per year through 2017
|
Source: Company reports.